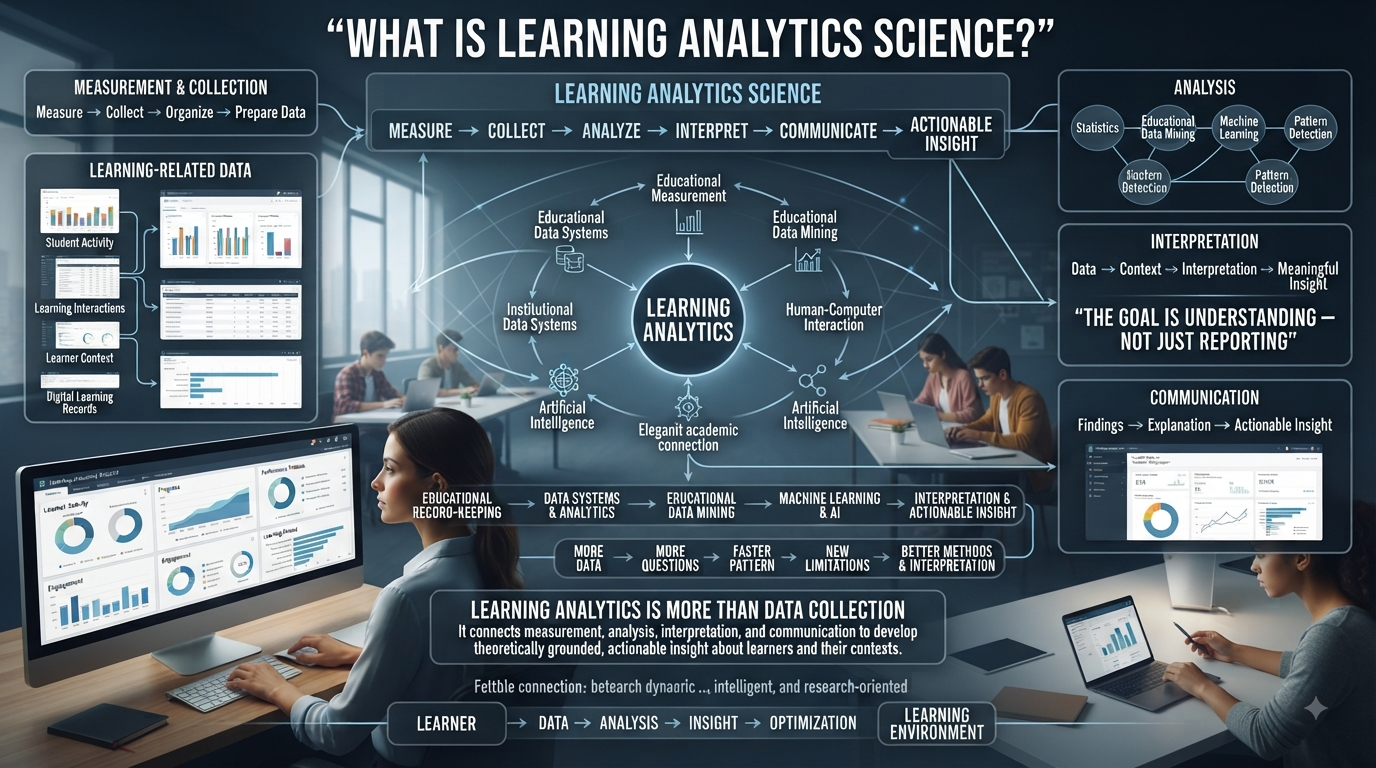
What Is Learning Analytics Science | Learning analytics has evolved from simple educational record-keeping into a sophisticated, interdisciplinary field focused on understanding learning-related data at scale. The most widely cited definition comes from the Society for Learning Analytics Research (SoLAR), formalized at the first LAK conference in 2011: learning analytics is the measurement, collection, analysis, and reporting of data about learners and their contexts, undertaken to understand and optimize learning and the environments in which it occurs. In 2025, marking the definition’s fifteenth anniversary, SoLAR’s executive committee revisited and updated it to emphasize the interpretation and communication of data toward theoretically grounded, actionable insight — a small but telling shift that mirrors the field’s own maturation.
The field did not emerge from a single technology or moment. It formed at the convergence of educational measurement, institutional data systems, statistics, educational data mining, human-computer interaction, and — later — machine learning and artificial intelligence. Early alternative definitions reflect this mixed parentage: George Siemens described it in 2010 as the use of intelligent, learner-produced data and analysis models to discover connections and to predict and advise on learning, while Elias (2011) framed it as a field closely tied to business intelligence, web analytics, academic analytics, and educational data mining.
Understanding this evolution matters because modern practice makes far more sense when viewed as a sequence of distinct, overlapping stages. Each stage expanded the type of data available, the questions researchers could ask, and the speed at which patterns could be detected — and each stage also introduced a new limitation that the next stage had to address.
Looking for comprehensive classroom resources and educational technology insights? Explore GimkitApp for expert guides, teaching strategies, game modes, and the latest updates to enhance student engagement.
Stage One: From Educational Records to Digital Learning Data
Early educational data was largely administrative: grades, attendance, enrollment, examination results, and course completion. These records were valuable but retrospective by nature.
Teaching → Learning Period → Assessment → Recorded Result
Data generally became useful only after an event had already occurred. A final grade could show that a learner had succeeded or struggled, but it revealed little about the sequence of activity that produced that result.
The expansion of digital systems changed this. Learning management systems, online assignments, computer-based testing, and discussion platforms began generating records continuously — capturing when resources were accessed, how frequently learners interacted with materials, submission patterns, and progress over time.
Earlier Educational DataEmerging Digital Learning Data
Grades
Activity sequences
Attendance records
Online participation patterns
Enrollment information
Interaction histories
Examination results
Multiple assessment events
Course completion
Progress over time
Periodic reports
Continuously generated records
The significant change wasn’t simply that more data existed — it was that educational activity itself became measurable, not just its final result.
Stage Two: The Influence of Educational Measurement
Learning analytics did not develop independently of earlier educational measurement traditions. For decades, researchers had measured achievement, evaluated interventions, and interpreted evidence about learning outcomes using established statistical methods.
As digital systems expanded, these analytical traditions gained access to far larger and more detailed datasets. The unit of analysis could move beyond a single examination score toward sequences of events, patterns across groups, and relationships between different forms of activity — a conceptual shift that became one of the field’s foundations.
Stage Three: The Rise of Learning Management Systems
The widespread adoption of learning management systems was one of the most consequential developments in the field’s history. Digital platforms began recording interactions automatically — logins, resource access, submissions, discussion posts, and assessment events — as a byproduct of ordinary educational activity, at a scale manual collection could never achieve.
However, the presence of data did not automatically make analysis meaningful. A system could log thousands of interactions without establishing what those interactions represented educationally — a limitation that remains one of the field’s central tensions today.
Stage Four: The Emergence of Learning Analytics as a Distinct Field
As digital environments became common, researchers began treating educational data analysis as a distinct area of inquiry rather than another form of institutional reporting. George Siemens and Phil Long’s 2011 EDUCAUSE article, “Penetrating the Fog: Analytics in Learning and Education,” was among the field-defining publications of this period, laying out definitions and the case for analytics in higher education. SoLAR describes the resulting discipline as sitting at the convergence of learning (educational research, assessment sciences, educational technology), analytics (statistics, visualization, data science, AI), and human-centered design.
That interdisciplinary character became central to the field’s identity — a shift from simply storing educational information toward interpreting it to understand processes and support decisions.
Stage Five: From Descriptive Reporting to Predictive and Diagnostic Analysis
A pivotal stage was the movement from descriptive reporting toward forward-looking analysis. Traditional reporting could answer how many learners completed the course? More advanced approaches investigate what patterns of activity were associated with different outcomes — and eventually, what is likely to happen next?
This progression is best understood as four connected analytical orientations, a framework widely used across analytics disciplines and adapted to education:
Analytical OrientationCentral Question
Descriptive
What happened?
Diagnostic
What patterns are associated with what happened?
Predictive
What may happen next?
Action-oriented
What response might be appropriate?
This did not make descriptive statistics obsolete — it became the foundation diagnostic and predictive analysis is built on.
The move into predictive territory was significant. One of the most cited demonstrations is Purdue University’s Course Signals, piloted from 2007 and built by Arnold and Pistilli. The system combined grades, demographic data, prior academic history, and LMS engagement into a predictive model, then delivered a red/yellow/green signal and personalized feedback to students. Purdue reported that students exposed to Course Signals at least once were retained at 87.4%, versus 69.4% for peers who were never exposed — a roughly 18-point gap, alongside improved four-year graduation rates.
That result also illustrates why interpretation matters as much as prediction: a 2013 re-analysis by other researchers questioned whether Course Signals’ reported retention gains held up under more rigorous causal scrutiny, sparking a wider debate about how early-alert systems should be validated before their results are treated as established fact. A prediction is not automatically an explanation, and a statistical association is not automatically a causal one — a theme that recurs throughout the field’s development.
Stage Six: From Historical Data to Near-Real-Time Analysis
Another major change was the shrinking gap between educational activity and analytical feedback. Earlier institutional analysis often depended on periodic reporting cycles — reviewed at the end of a term or during scheduled institutional reviews.
Periodic Review → Continuous Data Generation → More Timely Analysis
This allowed systems to detect changing patterns while a learning period was still underway rather than only after it ended. That said, faster analytics is not automatically better analytics — speed is only valuable when the underlying data is reliable and the resulting interpretation is sound.
Stage Seven: From Isolated Records to Behavioral Patterns and Longitudinal Analysis
A single login, submission, or assessment result rarely explains much on its own. The field matured significantly once it began examining sequences of events:
Resource Access → Practice Activity → Repeated Attempts → Reduced Participation → Assessment Result
As digital systems retained larger quantities of information over time, this encouraged a stronger longitudinal dimension — analysis across weeks, terms, and academic years rather than single snapshots, strengthening the field’s ability to study change rather than status at one point in time.
Stage Eight: The Expansion and Integration of Data Sources
Learning analytics also evolved through the diversification of its data sources: assessment systems, student information systems, digital collaboration environments, and other resource-usage records joined LMS logs as inputs.
Learning Platform + Assessment System + Student Information System + Digital Resources + Interaction Data → Integrated Educational Data → Learning Analytics
This diversification also introduced a technical challenge that the field takes seriously: interoperability. Efforts such as the xAPI (Experience API) and IMS Global’s Caliper Analytics specification emerged specifically to give different learning systems a shared way of recording and exchanging activity data, since data integration does not, by itself, guarantee that two systems mean the same thing by the same term. Bringing datasets together remains a prerequisite for good analysis, not a substitute for it.
Stage Nine: From Activity Counts to Learning-Relevant Interpretation
One of the field’s most important lessons was recognizing that raw activity is not equivalent to learning. A learner opening a resource ten times doesn’t automatically demonstrate deeper understanding, and low digital activity doesn’t necessarily mean meaningful learning hasn’t occurred — it might have happened offline, or through a channel the system doesn’t capture.
This pushed the field toward a more demanding question: what does this observed pattern reasonably tell us about the educational process? — strengthening the connection between data analysis and educational meaning.
Stage Ten: The Development of More Sophisticated Analytical Methods
As the field matured, researchers drew on a widening range of techniques: statistical modeling, classification, clustering, sequence analysis, network analysis, natural language processing, and machine learning.
Machine learning in particular expanded the range of patterns that could be examined across large learner populations and complex variable combinations. But this introduced a genuine trade-off: more computational power does not automatically mean more understandable evidence. A model can produce an accurate prediction without offering a straightforward explanation of the underlying relationship — and in education, the ability to interpret an output can matter as much as the ability to generate it.
Stage Eleven: The Rise of Learning Analytics Dashboards
Dashboards emerged to make complex data understandable to the educators, advisors, and administrators actually expected to act on it, organizing raw data into trends, indicators, and visual summaries. Research on dashboard design — such as work on “preparing learning analytics dashboards for educational practice” — has shown that a technically accurate result has limited value if its intended user cannot interpret it correctly, and that poorly designed visualizations can make a weak relationship look important or hide genuine uncertainty.
Good learning analytics therefore requires both analytical accuracy and responsible presentation — one without the other still produces a poor outcome.
Stage Twelve: From “More Data” to “Better Data”
The field’s growth also exposed a persistent misconception: that larger datasets automatically produce better analytics. They don’t. A very large but poorly defined, incomplete, or biased dataset can produce worse conclusions than a smaller, carefully structured one.
Modern learning analytics places increasing importance on data quality, completeness, consistent definitions, provenance, and honest acknowledgment of missing information. The central question shifted from how much data can we collect? to what information is actually meaningful for the question we’re trying to answer?
Stage Thirteen: Richer Learner Models — and Their Limits
As analytical systems matured, another development involved building richer representations of individual learners — profiles combining activity frequency, assessment history, progression, and interaction behavior, rather than a single score.
This creates a responsibility: a model of a learner is still a representation, not the learner themselves. A digital system might show reduced activity without revealing why — external responsibilities, access limitations, or offline learning strategies rarely show up in the logs. This pushed the field toward treating every behavioral indicator as evidence requiring interpretation, not a complete explanation on its own.
Stage Fourteen: From Individual Analytics to Institutional Analytics
Learning analytics also expanded beyond individual learner activity to examine broader patterns across courses, programs, cohorts, and institutions:
Individual → Course → Cohort → Program → Institution
Each level produces different analytical questions and requires different interpretation. A pattern visible at the institutional level may not explain what’s happening for a particular learner, and recognizing these levels — without collapsing them into one another — became increasingly important as the field scaled up.
Stage Fifteen: Personalization and Adaptive Analytics
As analytical capability expanded, learning analytics became increasingly connected to personalization — using analytical information to respond differently to different patterns of learner activity.
Personalization depends heavily on the quality of the learner model behind it. If the underlying interpretation is wrong, personalization can amplify the error by repeatedly acting on a mistaken assumption rather than correcting it — which is why adaptive systems have, if anything, increased the importance of accuracy and transparency rather than decreased it.
Stage Sixteen: Artificial Intelligence and the Current Direction of the Field
The most recent stage has been shaped by artificial intelligence, more capable machine learning, richer datasets, and more automated pipelines:
Data Generation → Data Integration → Pattern Detection → Modeling → Interpretation → Timely Insight → Educational Response
Generative AI adds a further dimension by making analytical information easier to summarize in plain language for non-specialists. But this hasn’t removed the need for human judgment — AI-generated interpretation inherits the limitations of the underlying data, the model’s assumptions, and any bias already present in the datasets. The more automated the process becomes, the more important it is to distinguish computed information from justified educational interpretation.
For the latest gaming news, expert reviews, and walkthroughs, readers can also visit IGN, one of the world’s leading gaming websites.
The Parallel Evolution of Ethics and Governance
Growing analytical capability created a parallel evolution in responsibility. Early enthusiasm often focused on what could technically be measured; modern practice increasingly asks what should be measured and what consequences could follow.
This shift has a well-documented origin point: concerns from governments, institutions, and civil-rights groups over the handling of learner data — including high-profile cases such as the shutdown of the inBloom student-data repository — led researchers Hendrik Drachsler and Wolfgang Greller to publish the DELICATE checklist in 2016, an eight-point framework covering purpose, access, anonymity, transparency, and data security that remains a standard reference for institutions implementing learning analytics responsibly. Its core principles map onto five recurring concerns:
Privacy. Educational data can contain detailed information about individual activity; responsible systems need appropriate safeguards around collection, storage, access, and use.
Transparency. Learners and educators need to understand what information is used and how outputs are generated, rather than treating a dashboard as a black box.
Fairness. Analytical models can reproduce or amplify patterns already present in historical data — accuracy and fairness are separate properties that both need checking.
Human oversight. Analytical outputs shouldn’t automatically replace professional judgment, particularly for decisions with real consequences for a learner.
Purpose limitation. Collecting data because it’s technically available doesn’t establish that every possible use of it is appropriate.
These concerns aren’t a separate track running alongside the field’s technical evolution — they are part of its maturation.
The Difference Between Analytics and Automated Decision-Making
A particularly important modern distinction is between providing analytical evidence and making decisions automatically:
Each additional step increases the importance of validation, context, and oversight. The evolution of learning analytics is not simply a progression toward more automation — it is also a progression toward understanding where automation is appropriate and where human interpretation genuinely remains necessary.
Implementation Challenges Institutions Actually Face
Beyond the conceptual evolution, adopting learning analytics in practice tends to surface a consistent set of organizational challenges:
Faculty and staff buy-in. A dashboard is only useful if the people expected to act on it trust its output and understand what it’s telling them.
Change management. Moving from periodic grade checks to continuous activity monitoring is a workflow change, not just a technology change.
Cost and resourcing. Beyond the initial system, ongoing costs include data integration, staff training, dashboard maintenance, and the analytical expertise needed to keep interpreting results responsibly.
Data silos. Many institutions still run separate systems for admissions, LMS, assessment, and student support that were never designed to share data — making integration as much an organizational problem as a technical one.
Sustaining momentum. Early pilots often show promising results with enthusiastic adopters; scaling that success institution-wide, with more varied populations, is a harder challenge — as the Course Signals debate above illustrates.
Key Terminology in Learning Analytics
TermMeaning
Descriptive analytics
Analysis summarizing what has already happened
Predictive analytics
Analysis estimating what is likely to happen next
Learner model
A data-based representation of an individual learner’s activity and progress
Dashboard
A visual interface presenting analytical output to non-technical users
Data provenance
Information about where a dataset came from and how it was generated
Semantic consistency
Whether different systems define and measure the same concept comparably
Actionable insight
Analytical output specific and timely enough to inform a real decision
Algorithmic bias
Systematic errors in a model’s output that disadvantage particular groups
xAPI / Caliper
Interoperability standards for recording and exchanging learning activity data
Where Learning Analytics Is Applied
Higher education. The most extensively studied and deployed setting, typically focused on retention, progression tracking, and early-alert systems like Course Signals.
K-12 education. Applications tend to focus on formative feedback within a single course, tracking progress against specific learning objectives — shorter feedback loops suit near-real-time analysis particularly well.
Corporate and workplace training. Organizations track completion of mandatory training and assess skill development; connecting training data to on-the-job performance remains one of the harder open problems in the field.
MOOCs and large-scale online courses. With enrollments sometimes in the tens of thousands, these platforms generate enormous behavioral datasets and were among the earliest large-scale testing grounds for predictive and pattern-discovery methods, precisely because manual advising doesn’t scale to that population size.
How Learning Analytics Differs From Simple Reporting
Simple ReportingLearning Analytics
Summarizes what already happened
Also examines patterns, relationships, and likely outcomes
Typically periodic
Can operate continuously or near-real-time
Usually a single data source
Often integrates multiple systems and data types
Presents data
Aims to support interpretation and decision-making
Static output
Can adapt or personalize based on ongoing activity
Common Misconceptions About Learning Analytics
“More data always means better analytics.” Quality, relevance, and context matter more than volume.
“A prediction explains why something is happening.” A predictive model can estimate an outcome without identifying its cause — as the Course Signals debate demonstrates, association is not causation.
“High digital activity equals strong learning.” Frequent logins or clicks are indicators, not proof.
“An accurate model is automatically a fair or appropriate one.” Statistical accuracy and educational appropriateness are different properties.
“Real-time is always better than retrospective.” Speed without sound underlying data just makes a weak decision faster.
“Dashboards remove the need for interpretation.” Visualization makes data easier to look at, not automatically easier to interpret correctly.
Learning Analytics vs. Related Fields
FieldHow It Differs From Learning Analytics
Educational data mining
Focuses more narrowly on discovering patterns using data-mining techniques; learning analytics has a broader concern with interpretation and decision-support
Academic analytics
Typically applied at the institutional/administrative level; learning analytics more often centers on the individual learner
Institutional research
Concerned with broad institutional reporting and planning; learning analytics is tied to the ongoing learning process itself
Educational data science
A broader technical discipline covering methods and tools; learning analytics applies those tools with a specific focus on learning
A Worked Example: One Institution’s Path Through the Stages
Consider a simplified trajectory. An institution begins with paper-based grade books — pure administrative record-keeping. It adopts a learning management system and gains access to login timestamps and submission records, initially using this data only to replicate the same old reports, just faster. Staff begin asking diagnostic questions: which activity patterns tend to precede a failing grade? This leads to a basic predictive model — not unlike Purdue’s early Course Signals pilot — flagging at-risk learners early enough for an advisor to reach out.
As more systems come online, the institution faces the integration challenge, since these systems rarely share definitions or timestamps. A dashboard is introduced so advisors without a data background can act on flagged patterns. Eventually, the institution introduces AI-assisted summaries for advisors — but only after establishing clear policies on privacy, transparency, and human review, informed by frameworks like DELICATE.
Institutions that skip stages — jumping to AI-assisted prediction without first solving basic data integration — tend to rediscover those earlier limitations the hard way.
How to Evaluate a Learning Analytics System or Claim
Is the underlying data quality addressed? A system built on incomplete data can’t be trusted regardless of modeling sophistication.
Does a prediction come with its limitations stated? A credible system distinguishes probability from certainty.
Is activity data treated as an indicator or as proof? Claims that equate digital activity with learning deserve scrutiny.
Who reviews flagged cases before action is taken? A system with no human oversight step is a governance gap.
Is the analysis transparent to the people it affects?
Does the system distinguish individual, cohort, and institutional patterns?
What the Evolution Has Actually Taught the Field
Data is not the same as evidence.
Prediction is not explanation — the Course Signals retention debate is a real-world case study in why.
Activity is not automatically learning.
More data is not automatically better data.
Faster analytics is not automatically better analytics.
Automation does not eliminate judgment.
Where Learning Analytics Is Heading
The field’s current direction points toward systems that are increasingly multimodal, continuous, more accurately predictive, genuinely adaptive, AI-assisted in how results are communicated, better interoperable across platforms via standards like xAPI and Caliper, and more deeply personalized.
None of this makes the field’s foundational principles obsolete. The central challenge remains what it has been at every stage: how can data generated through learning-related activity be transformed into accurate, meaningful, contextualized information that genuinely improves understanding?
Frequently Asked Questions
1. When did learning analytics begin?
Learning analytics developed from earlier work in educational measurement, institutional reporting, and educational data mining. It became recognized as a distinct field around the first Learning Analytics and Knowledge (LAK) conference in 2011, alongside the development of the Society for Learning Analytics Research (SoLAR).
The field has since expanded from basic reporting toward more sophisticated analysis of learner activity, engagement, progression, and outcomes.
Its development includes:
Educational measurement.
Institutional data analysis.
Educational data mining.
Digital learning records.
Learning management system data.
Modern predictive and AI-assisted analytics.
2. How has learning analytics changed over time?
Learning analytics has progressed from primarily retrospective reporting toward descriptive, diagnostic, predictive, and increasingly real-time analysis. Modern systems can combine information from learning platforms, assessments, interactions, and other digital sources to identify patterns and support educational decisions.
At the same time, the field has placed greater emphasis on data quality, transparency, privacy, ethics, and responsible interpretation because increasingly detailed learner data can create significant risks when misunderstood or misused.
Major developments include:
Descriptive dashboards.
Diagnostic analysis.
Predictive analytics.
Near-real-time monitoring.
Multi-source data integration.
AI-assisted analysis.
Stronger ethical frameworks.
3. Can learning analytics measure learning directly?
Not completely. Learning analytics generally analyzes observable data traces—such as activity, assessment results, participation, or progression—which serve as indicators of learning rather than direct measurements of everything a learner knows or understands.
A student may interact frequently with an online platform without necessarily mastering the underlying concepts, while another student may learn effectively with relatively little digital activity. Therefore, analytics should be interpreted alongside assessments, teacher judgment, context, and other evidence.
Important limitations include:
Digital activity is not identical to learning.
Data may omit important context.
Different behaviors can have different meanings.
Algorithms can misinterpret patterns.
Human interpretation remains important.
4. Is learning analytics always accurate?
No. Learning analytics can be highly useful, but its reliability depends on the quality, completeness, relevance, and interpretation of the underlying data. Incomplete records, measurement limitations, biased datasets, technical errors, or missing contextual information can produce misleading conclusions.
Predictive systems should therefore be treated as decision-support tools rather than unquestionable authorities. Independent validation and human review are especially important when analytics influence significant educational decisions.
Accuracy can be affected by:
Incomplete learner data.
Poor measurement.
Dataset bias.
Technical errors.
Missing context.
Weak predictive models.
Incorrect interpretation.
5. Why are ethics increasingly central to learning analytics?
Modern learning analytics can process detailed information about learners’ behavior, progress, interactions, and performance. Greater analytical capability therefore creates greater responsibility around privacy, transparency, fairness, consent, security, and appropriate data use.
Ethical frameworks such as DELICATE reflect the field’s growing recognition that collecting and analyzing educational data should serve legitimate learning purposes while minimizing unnecessary risks. Responsible analytics requires institutions to consider not only what they can measure, but also what they should collect, infer, and act upon.
Responsible learning analytics should prioritize:
Learner privacy.
Data security.
Transparency.
Fairness.
Appropriate data collection.
Human oversight.
Clear educational purpose.
Professional Recommendations & Expert Reviews
What Is Learning Analytics Science is the systematic study of how learning-related data can be collected, analyzed, interpreted, and used to improve education.
What Is Learning Analytics Science goes beyond tracking student activity because it focuses on understanding what educational data actually means.
What Is Learning Analytics Science combines learning theory, data analysis, educational research, statistics, and technology.
What Is Learning Analytics Science examines how evidence about learning can support better decisions by teachers, students, and institutions.
What Is Learning Analytics Science focuses on finding meaningful patterns within information generated during learning activities.
What Is Learning Analytics Science helps explain how data can reveal changes in participation, progress, performance, and learning behavior.
What Is Learning Analytics Science treats data as evidence that requires interpretation rather than as an automatic answer.
What Is Learning Analytics Science considers how different types of educational data can contribute to understanding learning.
What Is Learning Analytics Science can examine assessment results, activity records, interactions, submissions, and other relevant learning evidence.
What Is Learning Analytics Science studies how these different forms of evidence can be connected to meaningful educational questions.
What Is Learning Analytics Science recognizes that data becomes useful only when it helps explain or improve something important.
What Is Learning Analytics Science examines descriptive methods that help educators understand what has already happened.
What Is Learning Analytics Science also considers diagnostic methods that explore possible reasons behind observed learning patterns.
What Is Learning Analytics Science can involve predictive methods that estimate possible future outcomes from existing evidence.
What Is Learning Analytics Science may also support recommendations when analysis identifies an appropriate educational response.
What Is Learning Analytics Science emphasizes that predictions should be treated as evidence-based estimates rather than guaranteed outcomes.
What Is Learning Analytics Science studies how analytics can support earlier recognition of learning difficulties.
What Is Learning Analytics Science can help educators notice changes that might otherwise remain hidden within large amounts of student information.
What Is Learning Analytics Science supports the idea of using evidence to make instructional decisions more informed.
What Is Learning Analytics Science can help teachers identify which students may need additional explanation, practice, or support.
What Is Learning Analytics Science also examines whether interventions based on analytics actually improve student outcomes.
What Is Learning Analytics Science therefore connects analysis with action rather than stopping at data collection.
What Is Learning Analytics Science considers student progress as a process that can be examined across time.
What Is Learning Analytics Science can reveal whether participation or performance is increasing, decreasing, or remaining stable.
What Is Learning Analytics Science helps educators look for trends instead of relying only on individual results.
What Is Learning Analytics Science can support personalized learning when data provides enough evidence to justify individual adjustments.
What Is Learning Analytics Science recognizes that personalization should not depend on simplistic assumptions about learners.
What Is Learning Analytics Science examines how students interact with resources, activities, assessments, and learning environments.
What Is Learning Analytics Science can help identify resources that appear useful, underused, confusing, or poorly aligned with learning goals.
What Is Learning Analytics Science can support course improvement by showing where learners experience difficulties.
What Is Learning Analytics Science examines the relationship between learner behavior and educational outcomes.
What Is Learning Analytics Science does not assume that every visible behavior directly represents learning.
What Is Learning Analytics Science recognizes that frequent activity may indicate engagement but does not automatically prove understanding.
What Is Learning Analytics Science therefore requires educational context when interpreting behavioral data.
What Is Learning Analytics Science values teacher expertise because educators can understand circumstances that data alone may not reveal.
What Is Learning Analytics Science works best when analytical evidence and professional judgment complement each other.
What Is Learning Analytics Science also considers how analytics can support students in understanding their own learning.
What Is Learning Analytics Science can provide learners with information about progress, performance, participation, and areas for improvement.
What Is Learning Analytics Science can encourage students to reflect on their study strategies and learning habits.
What Is Learning Analytics Science examines how feedback from analytics can influence future learning behavior.
What Is Learning Analytics Science recognizes that feedback is more useful when learners can understand and act on it.
What Is Learning Analytics Science can support dashboards that present complex learning information in a simpler visual form.
What Is Learning Analytics Science evaluates whether these visualizations actually help users make better decisions.
What Is Learning Analytics Science considers data quality because inaccurate or incomplete information can produce misleading conclusions.
What Is Learning Analytics Science therefore requires careful collection, processing, and interpretation of learning data.
What Is Learning Analytics Science examines how different data sources can complement each other.
What Is Learning Analytics Science can create stronger insights when assessment evidence is considered alongside learning activity and contextual information.
What Is Learning Analytics Science also studies the limitations of combining different datasets.
What Is Learning Analytics Science recognizes that more data does not automatically mean better understanding.
What Is Learning Analytics Science encourages organizations to collect information for meaningful educational purposes.
What Is Learning Analytics Science includes important questions about privacy, transparency, fairness, and responsible data use.
What Is Learning Analytics Science considers how learners should understand the ways their information is being analyzed.
What Is Learning Analytics Science requires careful attention to potential bias within data and analytical models.
What Is Learning Analytics Science recognizes that biased data can lead to unfair conclusions or inappropriate interventions.
What Is Learning Analytics Science therefore encourages regular evaluation of analytical systems and their educational consequences.
What Is Learning Analytics Science can involve statistical techniques for identifying relationships, trends, differences, and patterns.
What Is Learning Analytics Science can also involve machine learning when large datasets require more advanced forms of analysis.
What Is Learning Analytics Science does not mean that artificial intelligence should replace educational judgment.
What Is Learning Analytics Science uses technology as a tool for understanding learning rather than treating technology as the purpose itself.
What Is Learning Analytics Science can help institutions evaluate courses, programs, support systems, and broader educational strategies.
What Is Learning Analytics Science can provide evidence for improving learning environments when institutional data is interpreted responsibly.
What Is Learning Analytics Science examines both the benefits and limitations of data-driven educational decision-making.
What Is Learning Analytics Science recognizes that educational outcomes are influenced by many factors that may not appear in a dataset.
What Is Learning Analytics Science therefore avoids making strong conclusions from isolated indicators.
What Is Learning Analytics Science encourages continuous evaluation to determine whether analytics are producing meaningful educational improvements.
Final Perspective
The evolution of learning analytics has changed the role of educational data — from something used primarily to describe what already happened, into something that can help reveal patterns, anticipate developments, and support timely understanding of learning as it unfolds.
Each stage introduced genuine new capability while surfacing a new limitation the next stage had to address: descriptive reporting revealed the need for pattern discovery, pattern discovery revealed the need for prediction, prediction revealed the need for careful interpretation (as Purdue’s own Course Signals debate shows), and growing analytical power revealed the need for stronger governance.
Modern learning analytics combines historical educational records, digital activity data, statistical analysis, machine learning, visualization, and increasingly AI-assisted methods — while remaining, at its core, a field built on one enduring principle: technological capability only becomes real understanding when paired with responsible, contextualized, human interpretation of what the data actually means.