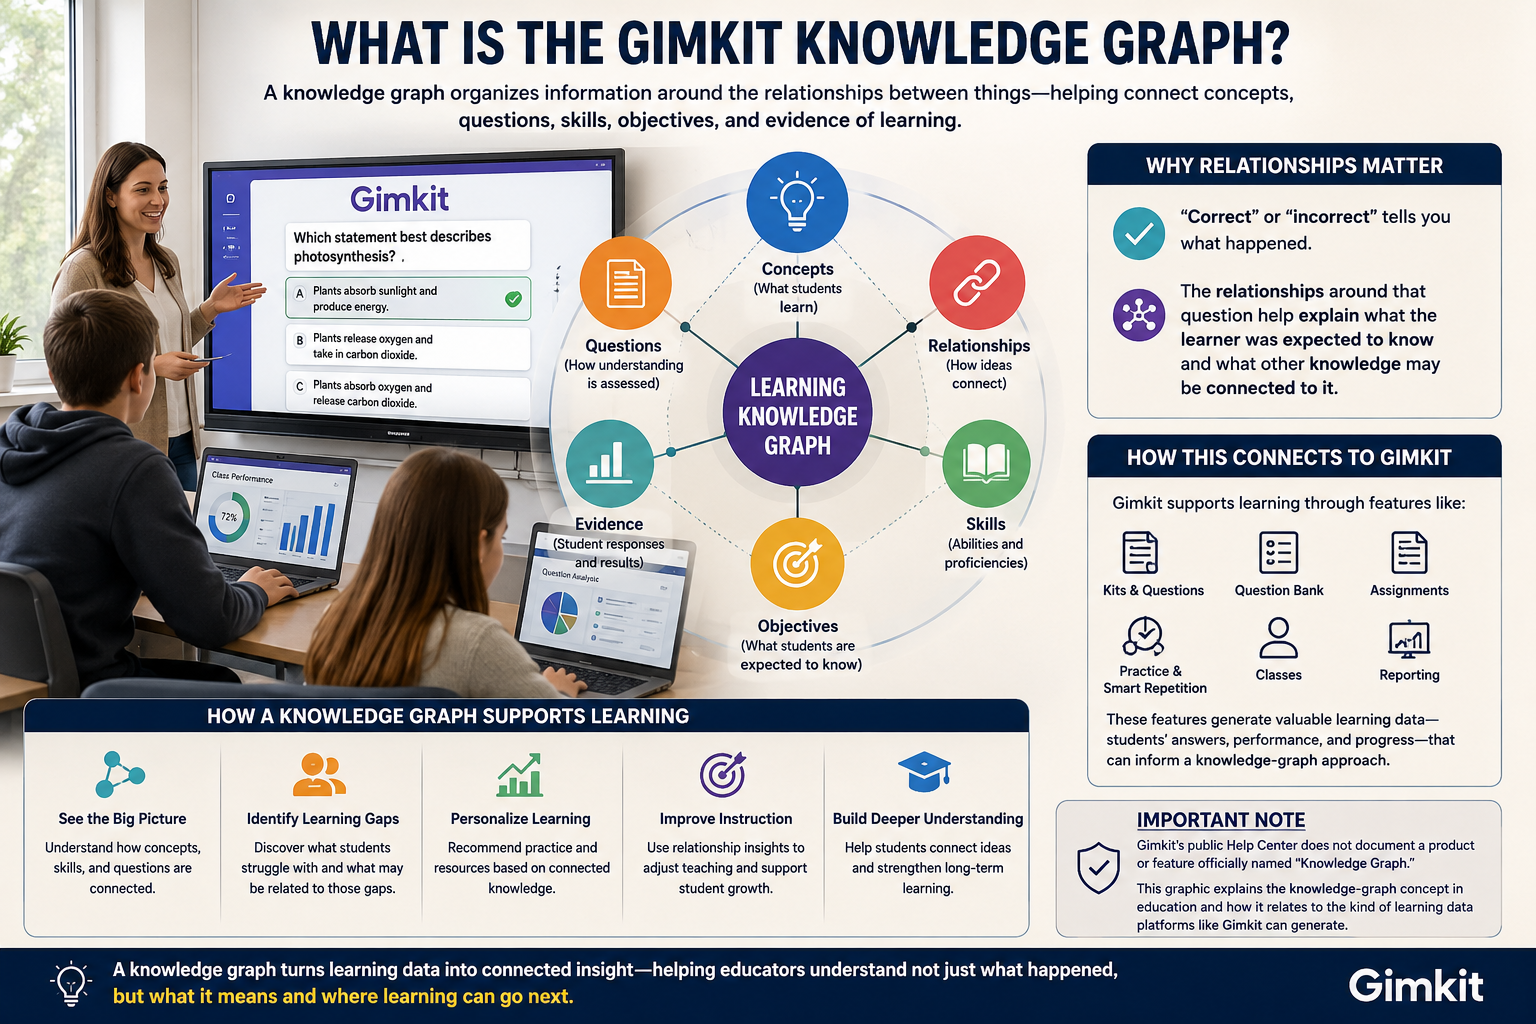
What Is the Gimkit Knowledge Graph?A knowledge graph is a way of organizing information around the relationships between things—not just the things themselves. In education, those things can include concepts, skills, questions, learning objectives, resources, and evidence of student learning.
That distinction matters because a question result by itself is limited. “Correct” or “incorrect” tells you what happened; the relationships around that question can help explain what the learner was expected to know and what other knowledge may be connected to it.
For Gimkit, this needs to be framed carefully. Gimkit publicly documents Kits, questions, Question Bank, Assignments, Classes, practice, Smart Repetition, and reporting, but its current public Help Center does not document a product or feature officially named “Knowledge Graph.”
So the useful subject here is the knowledge-graph concept in an educational platform and how it relates to the kind of learning data a platform such as Gimkit can generate—without inventing an undocumented Gimkit architecture.
Looking for comprehensive classroom resources and educational technology insights? Explore GimkitApp for expert guides, teaching strategies, game modes, and the latest updates to enhance student engagement.
What Is a Knowledge Graph?
A knowledge graph represents entities and the relationships connecting them.
In a normal content system, information might look like this:
Question 24 → Fractions
A graph can represent much more:
Fractions
│
├── includes → Equivalent Fractions
│
├── supports → Fraction Addition
│
└── assessed by → Question 24
Now the question is no longer an isolated item. It sits inside a structure of related knowledge.
In education, those entities can include:
Entity
Example
Subject
Mathematics
Topic
Fractions
Concept
Equivalent fractions
Skill
Compare fractions
Prerequisite
Understanding numerator and denominator
Question
“Which fraction is larger?”
Learning objective
Compare unlike fractions
Resource
Practice activity
Learner
Student
Evidence
Correct or incorrect response
The relationships are what turn this collection into a knowledge model.
A systematic review of educational knowledge graphs found applications across personalized learning, curriculum design, concept mapping, semantic search, question answering, and educational content recommendation.
Why Relationships Matter More Than a List of Questions
Consider two students who both miss the same question.
A basic system records:
Student A — incorrect Student B — incorrect
But the reason may be completely different.
Student A might understand the underlying concept but make a calculation mistake.
Student B might not understand the prerequisite skill at all.
The question itself cannot always distinguish those situations.
A richer educational structure can connect the item to the knowledge it is intended to measure:
Question
↓ assesses
Fraction Addition
↓ depends on
Equivalent Fractions
↓ builds on
Fraction Concepts
Now the response has context.
That does not automatically diagnose the learner. It simply gives an educational system a better structure for interpreting evidence.
This distinction is important: a knowledge graph provides relationships; determining what a student actually knows requires additional evidence and learner-modeling methods.
Knowledge Graph vs. Question Bank
A Question Bank and a knowledge graph may contain some of the same information, but they serve fundamentally different purposes.
Gimkit’s Question Bank, for example, lets teachers search questions from public Kits and add selected questions to their own Kits.
That is content discovery and reuse.
A knowledge graph asks a different question:
How does this question relate to the knowledge being assessed?
Question Bank
Knowledge Graph
Finds questions
Connects knowledge
Organizes assessment content
Represents relationships
Helps teachers build Kits
Can model concepts and dependencies
Focuses on available items
Focuses on meaning and connections
Answers “What can I use?”
Can help answer “How is this connected?”
For example, a question bank might store:
What is 3/4 + 1/4?
A knowledge structure could associate that question with:
Question
↓ assesses
Fraction Addition
↓ requires
Common Denominators
↓ related to
Equivalent Fractions
That additional structure is where the educational value becomes more interesting.
A Knowledge Graph Is Not the Same as Student Performance Data
This distinction is just as important.
A graph may represent:
Question 18 → assesses → Decimal Multiplication
Performance data may record:
Student A → answered → Question 18 → incorrectly
These are two different kinds of information.
Put together:
Knowledge Structure
Question 18
↓
Decimal Multiplication
Learner Evidence
Student A
↓
Incorrect response
↓
Question 18
Now the platform has both:
what the question represents, and
what the learner did with it.
That combination can support more meaningful analysis than either dataset alone.
Research into educational knowledge graphs describes this broader use of connected educational entities and learner information for personalized learning and recommendation systems.
Where Gimkit Enters the Picture
Gimkit already creates several relationships between classroom content and learner activity.
A teacher can build a Kit containing questions, use that content in supported activities, assign work to students, and inspect resulting performance data. Gimkit’s current reporting system provides Student Overview, General Overview, and Question Breakdown views for game reports.
Assignments add another layer. Teachers can view results, filter them, and open individual student reports; Gimkit also supports assignment reporting through its Kits and dashboard.
So the documented workflow can be represented simply:
Teacher
↓
Kit
↓
Questions
↓
Student Activity
↓
Responses
↓
Reports
That is already a connected learning workflow.
But it should not be relabeled as proof of a formal internal knowledge graph.
The difference between connected educational data and a knowledge-graph architecture is important.
What Would Make That Structure a True Knowledge Model?
The missing ingredient is semantic structure.
Suppose a Kit contains 20 questions about mathematics.
Knowing that all 20 questions belong to the same Kit tells us something about organization.
Knowing that:
Question 1 → assesses → Multiplication
Question 2 → assesses → Division
Question 3 → assesses → Fractions
Question 4 → requires → Multiplication
Question 5 → requires → Equivalent Fractions
tells us something about the knowledge represented by the content.
The system is no longer concerned only with where an item is stored.
It knows—or is explicitly modeled to know—what that item means in relation to other learning concepts.
That is the defining shift.
The Core Structure of an Educational Knowledge Graph
A useful educational graph can be thought of as several connected layers:
Learning Objectives
↓
Concepts
↓
Skills
↓
Prerequisites
↓
Assessment Items
↓
Learner Responses
↓
Learning Evidence
Each layer answers a different question.
Layer
Key question
Learning objective
What should the learner achieve?
Concept
What knowledge is involved?
Skill
What should the learner be able to do?
Prerequisite
What supports this ability?
Assessment item
How is it being tested?
Response
What did the learner do?
Evidence
What does the accumulated activity suggest?
This separation prevents a common mistake: treating a question, a skill, and a topic as if they were the same thing.
They are not.
Why Prerequisites Are So Important
Learning often has dependencies.
A student may encounter:
Linear equations
before becoming completely comfortable with the underlying skills needed to solve them.
A simplified structure might look like:
Arithmetic Fluency
↓
Algebraic Expressions
↓
One-Step Equations
↓
Multi-Step Equations
If a learner struggles with multi-step equations, the most useful intervention is not necessarily another multi-step equation.
The difficulty could be rooted in an earlier concept.
A graph can represent those dependencies explicitly.
This is one reason educational knowledge graphs are studied for personalized learning: they can model relationships among concepts and learner information rather than treating every learning event independently.
One Question Can Represent More Than One Skill
Educational content becomes much more informative when questions are connected to the skills they actually require.
Consider:
A teacher has 32 students. Three-eighths completed the assignment. How many students completed it?
The question involves more than the word “fractions.”
A learner may need to:
interpret a fraction;
understand a whole quantity;
multiply a whole number by a fraction;
perform the calculation;
interpret the result.
A graph-oriented model could represent those relationships:
Word Problem
│
├── assesses → Fraction Interpretation
├── requires → Multiplication
└── uses → Whole-Number Knowledge
If the learner answers incorrectly, the result becomes more useful when the assessment model knows which abilities the item was designed to exercise.
Without that mapping, an incorrect answer remains just an incorrect answer.
Knowledge Graphs vs. Knowledge Tracing
These concepts are related, but they should never be treated as synonyms.
Knowledge graph
Describes the structure of knowledge.
Knowledge tracing
Attempts to estimate a learner’s changing knowledge state from interaction history.
A simplified relationship looks like this:
Knowledge Graph
↓
Concept relationships
↓
Question / Skill mapping
↓
Learner interactions
↓
Knowledge-tracing model
↓
Estimated learner state
Recent research continues to combine graph structures with knowledge tracing and personalized recommendation, particularly to model relationships among concepts while interpreting sequences of learner responses.
The distinction matters because a platform can have learner-response data without having a knowledge graph, and it can have a knowledge graph without accurately estimating what a particular learner knows.
The Most Useful Mental Model
If the technical terminology feels complicated, reduce the entire idea to this:
A question tells the system what was asked. A response tells it what the learner did. A knowledge structure connects that activity to the knowledge being assessed.
That gives us:
Question
↓
Skill / Concept
↓
Learner Response
↓
Evidence
Add prerequisite relationships and relevant resources, and the structure becomes more powerful:
Prerequisite
↓
Concept
↓
Skill
↓
Question
↓
Response
↓
Evidence
↓
Relevant Next Step
That final connection—from evidence to an appropriate next step—is where knowledge graphs become particularly interesting for modern educational platforms.
What the Concept Does—and Does Not—Tell Us About Gimkit
It is useful to draw a firm line here.
Gimkit’s public documentation confirms a connected ecosystem involving Kits, questions, assignments, student activity, repetition, and reports. Its Smart Repetition feature, for example, prioritizes questions a student previously answered incorrectly, and Gimkit describes the repetition behavior as student-specific.
Those capabilities show that student responses can influence later activity.
They do not, by themselves, establish that Gimkit internally maintains a formal semantic knowledge graph connecting curriculum concepts, prerequisites, and learner mastery.
That is a technical claim that would require direct documentation from Gimkit.
For an accurate article, the safest and most useful approach is therefore to explain what a knowledge graph contributes to an educational platform, then use Gimkit’s documented learning workflow as the practical context—not to invent an internal system that has not been publicly described.
Why This Distinction Makes the Topic More Valuable
Without this distinction, an article can easily become a collection of impressive-sounding claims about AI, adaptive learning, and hidden platform technology.
That does not help a teacher.
The useful question is much more practical:
What additional understanding becomes possible when educational content and learner activity are connected by meaningful relationships?
The answer is the foundation for the next part: how those relationships can support learning-gap detection, personalization, assessment design, teacher decision-making, and more intelligent educational workflows—and where the technology can still get things wrong.
How Can a Knowledge Graph Help Understand What a Student Knows?
The biggest educational benefit of a connected knowledge model is not simply storing more student data. It is putting assessment evidence into context.
A student’s incorrect answer is an observation. By itself, it does not prove why the answer was wrong. When an assessment item is connected to the concept, skill, prerequisite, and learning objective it was designed to measure, the same response can become more informative.
This is also where the distinction between a knowledge graph and knowledge tracing becomes important. A graph describes the relationships among knowledge entities; knowledge-tracing approaches use sequences of learner interactions to estimate changing knowledge states. They can complement each other, but neither should be confused with the other.
From “Wrong Answer” to “What Might Need Attention?”
Imagine a student misses three questions:
Question
Topic
Skill
Result
1
Fractions
Compare fractions
Correct
2
Fractions
Equivalent fractions
Correct
3
Fractions
Add fractions
Incorrect
4
Fractions
Add fractions
Incorrect
5
Fractions
Add fractions
Incorrect
A conventional score might simply report:
2 correct / 5 questions
A concept-aware model has another piece of information:
All three missed questions target the same skill.
That does not automatically prove the learner has a persistent weakness. It does, however, provide a stronger reason to investigate fraction addition than the overall score alone.
This is the difference between performance measurement and instructionally useful interpretation.
Why Repeated Evidence Matters
One response should rarely be treated as a complete picture of a learner.
A student can miss an otherwise familiar question because they:
misread the wording;
rushed;
guessed;
made a calculation error;
misunderstood an instruction;
were distracted;
encountered an unusually difficult item.
A stronger system looks for a pattern across multiple interactions.
One response
     ↓
Weak evidence

Repeated responses
     ↓
Stronger pattern

Pattern across related skills
     ↓
More useful interpretation
This principle aligns with knowledge-tracing research, where learner knowledge is modeled as something that can change over time rather than as a permanent label attached after one answer.
Expert Insight
The more serious the instructional decision, the more important it is to base it on multiple pieces of evidence.
A knowledge graph can organize that evidence, but it should not turn uncertainty into false certainty.
For the latest gaming news, expert reviews, and walkthroughs, readers can also visit IGN, one of the world’s leading gaming websites.
Can It Reveal a Hidden Prerequisite Problem?
This is one of the most interesting applications.
Suppose students repeatedly struggle with:
Solving multi-step equations
The obvious response is to give them more multi-step equations.
But a connected model could expose relationships such as:
If evidence suggests difficulty with integer operations, additional practice at the advanced level may not address the underlying problem.
The better instructional move could be to temporarily step backward.
Observation
Possible interpretation
Potential response
Multi-step equations missed
Current skill may be difficult
Review worked examples
One-step equations also weak
Foundational issue possible
Reinforce equation-solving basics
Integer operations weak
Prerequisite may be involved
Review positive/negative operations
Earlier skills strong
Problem may be specific to multi-step process
Focus on sequencing and procedure
The key word is possible.
The graph can expose a relationship worth investigating; it should not manufacture a diagnosis.
How Could This Affect the Next Question?
A conventional quiz sequence might simply move from:
Question 10 → Question 11 → Question 12
A knowledge-aware learning system could instead consider the relationship between the learner’s recent evidence and the skills represented by available questions.
For example:
Student understands
       ↓
Equivalent Fractions
       ↓
Needs more evidence
       ↓
Fraction Addition
       ↓
Choose another suitable item
The next item is therefore selected for a reason.
It could:
reinforce the same skill;
test the concept using different wording;
check a prerequisite;
increase difficulty;
provide another piece of evidence;
move toward the next learning objective.
Research into graph-based knowledge tracing and adaptive task selection is exploring precisely this kind of relationship between learner state, concept structure, and personalized task sequencing.
This Is Different From Simply Repeating a Missed Question
This distinction is especially relevant when discussing Gimkit.
Gimkit’s Smart Repetition is designed to bring previously missed questions back into practice rather than treating every learner identically. Gimkit’s documentation describes the feature as prioritizing questions a student has previously answered incorrectly. (help.gimkit.com)
That is a useful form of response-based practice.
A knowledge graph addresses a different problem.
Response-based repetition
Knowledge-aware modeling
“Which question should return?”
“What knowledge does this question represent?”
Focuses on item history
Focuses on relationships
Revisits missed content
Can connect related concepts
Useful for reinforcement
Useful for contextual interpretation
Question-centered
Knowledge-centered
These approaches can complement one another.
A learner might miss a question, receive another opportunity to practice it, and—if the surrounding content were semantically mapped—those interactions could also contribute evidence about a broader skill.
But Gimkit’s documented Smart Repetition feature should not be described as a knowledge graph. They solve different problems.
Could It Personalize Learning Paths?
Potentially, yes.
Personalization becomes more meaningful when the system knows not only what the learner got wrong, but also where that content sits within the learning structure.
Imagine two learners studying the same unit.
Learner A
Strong in:
fractions;
equivalent fractions.
Needs more work with:
fraction addition.
Learner B
Strong in:
basic fractions.
Still developing:
equivalent fractions.
Both are working toward fraction addition.
But giving them identical practice may not be equally useful.
A connected model could represent:
Learner A
Equivalent Fractions ──► Fraction Addition
                              ▲
                         next target

Learner B
Basic Fractions ──► Equivalent Fractions ──► Fraction Addition
                         ▲
                    next target
This is the deeper idea behind personalized learning: different learners can move toward the same objective from different starting points.
Educational knowledge-graph research identifies personalized learning and resource recommendation among the major applications of these structures.
What Could This Mean for Teachers?
The teacher does not necessarily need another dashboard filled with numbers.
The useful outcome is a better answer to:
“What should I do with this information?”
Consider this progression:
Raw information
More useful interpretation
62% class average
Performance was mixed
8 students missed Question 7
Investigate the skill behind Question 7
Most missed items map to one concept
Consider targeted review
Missed items depend on a prerequisite
Check foundational understanding
One student repeatedly struggles with the same skill
Consider individual support
Students succeed after review
Evidence suggests the intervention helped
The graph is valuable only if it helps move from data to a reasonable instructional action.
Otherwise, it is just another layer of technical infrastructure.
Knowledge Graphs Could Also Improve Assessment Design
The value does not have to begin after students submit their answers.
The same structure can help teachers design assessments before a lesson or review session.
Suppose the learning objective is:
Students will solve linear equations.
A well-structured assessment might need evidence across:
understanding equality;
inverse operations;
one-step equations;
multi-step equations;
application problems.
Without mapping questions to those skills, an assessment may accidentally over-test one area while ignoring another.
A simple coverage view could look like this:
Skill
Planned questions
Assessment coverage
Equality concept
2
Moderate
Inverse operations
3
Strong
One-step equations
3
Strong
Multi-step equations
4
Strong
Real-world application
0
Missing
The teacher can immediately see the gap.
This makes a knowledge structure useful not only for learner analytics, but also for assessment alignment.
One Topic Does Not Mean One Skill
This is a common weakness in educational content organization.
A platform may label ten questions:
Topic: Fractions
But the questions might actually assess:
Question type
Primary skill
Identify larger fraction
Comparison
Simplify fraction
Reduction
Find equivalent fraction
Equivalence
Add fractions
Addition
Solve fraction word problem
Application
Treating all five as simply “fractions” loses valuable information.
That level of distinction can make learner evidence substantially more useful.
Could the Same Structure Recommend Learning Resources?
Yes, conceptually.
Suppose a learner needs more practice with:
Equivalent fractions
The graph could connect that skill to several types of resources:
Equivalent Fractions
       │
       ├── Practice Questions
       ├── Worked Examples
       ├── Review Activity
       ├── Video / Lesson
       └── Assessment Items
Instead of recommending a generic mathematics resource, a recommendation system could select material connected to the specific concept.
This is one reason educational knowledge graphs are studied for resource recommendation and semantic search.
Again, the graph does not make the recommendation automatically good. The connected resources still need to be relevant, accurate, age-appropriate, and instructionally sound.
What Happens When the Knowledge Map Is Wrong?
This is where the impressive promise of the technology meets a very practical limitation.
Suppose a question is incorrectly mapped:
Question: Add two fractions with unlike denominators Incorrect tag: Fraction comparison
Now imagine hundreds of responses are collected.
The system may conclude that many learners struggle with fraction comparison, when the assessment was actually testing something else.
This is why data quality is not a minor technical detail.
Research reviews of educational knowledge graphs identify challenges around knowledge extraction, graph construction, evaluation, and maintaining reliable educational relationships.
A smaller, carefully validated graph can be more useful than a huge graph containing noisy relationships.
AI Can Help Build the Structure—but It Should Not Be the Final Authority
Large educational content libraries contain enormous numbers of questions, lessons, objectives, and resources.
Manually mapping every relationship can be expensive.
AI can potentially assist by identifying candidate relationships.
For example:
Question: Solve 2x + 4 = 10 Possible concept: Linear equations Possible skill: Solve one-variable equations Possible prerequisite: Inverse operations
That can accelerate content organization.
But AI-generated mappings should be treated as proposals to validate, especially when they influence learner recommendations.
An automated model can misunderstand:
ambiguous wording;
curriculum-specific terminology;
the intended difficulty;
hidden prerequisite knowledge;
whether a question measures recall or application.
A human subject-matter expert can catch errors that a language model may not.
Best Practice
Use automation to scale organization; use educational expertise to protect meaning.
That principle becomes increasingly important as AI-generated educational content and analytics become more common.
Why a Knowledge Graph Should Not Become a Black Box
Imagine a teacher receives this message:
“Student needs remediation in algebra.”
That is not very actionable.
A better system could expose the evidence:
Evidence
Observation
6 recent questions
4 incorrect
Main skill
Solving one-variable equations
Related prerequisite
Inverse operations
Earlier evidence
Mixed performance
Confidence
Limited
Suggested action
Review prerequisite before reassessment
The teacher can then judge whether the recommendation makes sense.
This is a much healthier model for educational technology:
System analysis
      ↓
Evidence
      ↓
Teacher interpretation
      ↓
Instructional decision
rather than:
System analysis
      ↓
Automatic diagnosis
      ↓
Instruction
The first preserves professional judgment.
What a Knowledge Graph Can See—and What It Cannot
A structured model can be excellent at relationships, but classroom learning contains information that may never appear in a digital record.
A system may observe
A system may miss
Correctness
Student confidence
Response history
Why a student rushed
Question difficulty
Classroom distractions
Concept relationships
Informal teacher observations
Assignment completion
Emotional context
Repeated mistakes
Misunderstood instructions
That limitation should shape how results are interpreted.
Digital evidence is evidence—not the entire learner.
The Real Opportunity for Interactive Learning Platforms
Interactive platforms create something traditional worksheets often cannot: a detailed record of how learners interact with questions over time.
That makes them interesting sources of learning evidence.
When those interactions are connected to a reliable model of concepts and skills, the platform can potentially move beyond:
“How many questions did the student get right?”
toward:
“Which knowledge areas does the available evidence suggest need attention?”
That is a much more meaningful educational question.
And it explains why knowledge graphs are relevant to the broader evolution of educational platforms—even when a particular platform has not publicly confirmed that it uses a formal knowledge-graph architecture.
The Most Important Distinction
There are three different layers that should stay separate:
Layer
What it tells you
Platform data
What the learner did
Knowledge structure
What the content represents and how concepts relate
Learner model
What the accumulated evidence may suggest about the learner
Confusing these layers creates exaggerated claims.
Keeping them separate creates a much stronger understanding of how intelligent educational systems can work.
That distinction leads directly to the final question: what would a mature knowledge-aware learning system actually look like, what could it change for teachers and students, and what limitations should users keep in mind?
What Would a Mature Knowledge-Aware Learning System Look Like?
The strongest version of this idea would not be a feature that simply labels questions with topics. It would connect curriculum structure, assessment content, learner activity, and instructional resources in a way that helps a platform interpret evidence without pretending that a score is a complete picture of learning.
A simplified architecture could look like this:
Learning Objectives
        ↓
Concepts & Skills
        ↓
Prerequisites
        ↓
Questions / Activities
        ↓
Student Interactions
        ↓
Evidence Over Time
        ↓
Learner Model
        ↓
Potential Next Action
Each layer has a distinct job.
Layer
Purpose
Learning objectives
Define the intended outcome
Concepts and skills
Describe what must be learned
Prerequisites
Represent dependencies
Questions and activities
Collect evidence
Student interactions
Record what happened
Evidence over time
Reveal patterns
Learner model
Estimate current understanding
Next action
Support an instructional decision
The important point is that no single layer is the whole system.
A knowledge graph provides structure. Assessment provides evidence. Learner modeling interprets that evidence. Teachers still provide context and judgment.
How Could This Change the Way a Teacher Reads a Report?
A conventional report might tell a teacher:
Student: 72%
That is useful, but incomplete.
A more context-rich system could potentially organize the same evidence like this:
Area
Evidence
Fractions
Strong
Equivalent fractions
Strong
Fraction addition
Inconsistent
Fraction word problems
Limited evidence
Prerequisite: multiplication
Strong
Recommended review
Fraction addition
Now the teacher has something closer to an instructional map.
The score has not disappeared.
It has simply been placed inside a larger context.
That is one of the strongest potential advantages of structured educational knowledge: turning disconnected observations into relationships that are easier to interpret.
What Could Happen After a Student Struggles?
A mature system should not automatically assume:
“Wrong answer = reteach everything.”
Instead, it could follow a more measured sequence:
This is much more useful than making every learner follow the same remediation path.
Could It Support Mastery-Based Learning?
Potentially, yes.
Mastery-based approaches generally care about whether a learner has demonstrated sufficient understanding of a particular learning objective rather than simply accumulating a total score.
A connected knowledge structure can support that idea by organizing evidence around specific skills.
The learner’s overall mathematics score might look healthy while one specific skill remains underdeveloped.
That distinction can be valuable for targeted instruction.
However, a knowledge graph itself does not establish mastery. Mastery still requires an appropriate assessment model, enough evidence, and a defensible definition of what “mastered” means.
Knowledge Graphs Could Connect Assessment With Curriculum
Another major opportunity is alignment.
Teachers and curriculum designers often work with several separate objects:
learning standards;
objectives;
lessons;
activities;
questions;
assessments;
resources.
A connected model can represent their relationships.
If no assessment item connects to an important objective, the gap becomes visible.
If ten questions all measure the same narrow skill, the assessment may be unnecessarily repetitive.
This makes knowledge modeling relevant to curriculum planning as well as learner personalization. Educational knowledge-graph research identifies curriculum-related organization and personalized learning among its important application areas.
The Difference Between a Topic Map and a Learning Graph
Not every visual map of educational content deserves to be called a knowledge graph.
Consider:
Fractions
Decimals
Percentages
Ratios
This is a list.
Now consider:
Fractions
   │
   ├── converts to → Decimals
   │
   ├── converts to → Percentages
   │
   └── supports → Ratios
Now relationships are explicit.
Add questions:
Fractions
   ↓
Equivalent Fractions
   ↓ assessed by
Question 12
   ↓ answered by
Student A
   ↓
Incorrect
Now the model begins to connect knowledge with evidence.
That is considerably more useful than simply organizing content into folders.
Where Gimkit Fits Into This Larger Picture
Gimkit’s documented product ecosystem already contains several elements that can generate structured learning evidence.
Teachers can create and use Kits, assign work, organize students through Classes, practice questions, and review performance through reports. Gimkit’s documentation describes detailed game reports with student-level and question-level views.
Assignments provide another persistent learning workflow, including student results and reporting.
Gimkit also documents Smart Repetition as a way to prioritize previously missed questions for additional practice.
These are meaningful building blocks.
But they should be described accurately:
They demonstrate learner activity, assessment, repetition, and reporting—not public confirmation of a formal Gimkit knowledge graph.
That distinction should remain intact throughout any serious explanation of the subject.
What a Knowledge Graph Could Add Conceptually
If those documented components represent the activity layer, a knowledge graph could represent a semantic layer around the content.
That additional layer could, in principle, make it easier to reason about what the activity represents.
It is a conceptual architecture, not a claim about Gimkit’s private implementation.
Could This Make Interactive Games More Educationally Intelligent?
Potentially—but the value would come from the learning model, not the game mechanics themselves.
Interactive gameplay can increase participation and generate many learner interactions.
Those interactions become more useful when the platform can connect them to meaningful educational information.
For example:
Student plays
      ↓
Answers question
      ↓
Receives immediate feedback
      ↓
Response becomes evidence
      ↓
Evidence connects to skill
      ↓
Related activity becomes available
The game remains the engagement layer.
The knowledge structure sits underneath the learning process.
That separation is useful because engagement and instructional intelligence are different problems.
A game can be highly engaging without understanding a student’s conceptual needs.
A knowledge-aware system attempts to address the second problem.
What Are the Biggest Limitations?
Knowledge graphs sound powerful because relationships are powerful.
But building useful relationships at educational scale is difficult.
1. The content must be mapped correctly
If questions are assigned to the wrong concepts, later analysis can be misleading.
2. Concepts are not always cleanly separated
Real learning is messy. One question can involve several skills.
3. Prerequisites are often contextual
A curriculum may teach the same concept in a different sequence from another curriculum.
4. Learner evidence is imperfect
A wrong answer does not always indicate a knowledge gap.
5. Mastery is difficult to define
A learner can perform well on familiar question formats and still struggle when the context changes.
6. The graph can become enormous
Large educational systems may contain thousands or millions of concepts, resources, questions, and learner interactions.
7. Relationships can become outdated
Curricula, terminology, standards, and educational resources change.
These are not minor implementation details. They directly affect whether the resulting system can be trusted.
Why Transparency Matters
If a platform tells a teacher:
“This student needs help with equivalent fractions.”
the teacher should ideally be able to understand why.
A transparent evidence chain could look like:
Recommendation
     ↓
Based on 6 recent responses
     ↓
4 were incorrect
     ↓
3 questions assessed Equivalent Fractions
     ↓
Related prerequisite evidence is strong
     ↓
Confidence: Moderate
The teacher can then decide whether the interpretation makes sense.
This is much safer than presenting an unexplained label such as:
“AI says: weak in fractions.”
For educational systems, explainability is not just a technical luxury. It can directly affect teacher trust and the quality of instructional decisions.
Privacy Becomes More Important as the Model Gets Smarter
A richer learner model also means richer student data.
That creates an obvious responsibility:
collect only what is necessary, protect it appropriately, and make its use understandable.
The more a system tries to infer about a learner, the more important questions become around:
data retention;
access permissions;
student privacy;
teacher visibility;
institutional policies;
appropriate use of automated recommendations.
A system should not turn ordinary classroom mistakes into permanent labels about a student’s ability.
The objective should be to support learning—not create a fixed identity around performance.
A Better Way to Think About “Student Knowledge”
One of the most important conceptual safeguards is to avoid treating knowledge as a permanent database field:
Student = knows / does not know
Learning changes.
A more realistic representation is:
Previous Evidence
      ↓
Current Estimate
      ↓
New Interaction
      ↓
Updated Evidence
      ↓
Revised Estimate
This is closer to how knowledge-tracing research conceptualizes learner state: something that can evolve as new interactions occur.
That makes the system more responsive and less likely to overinterpret isolated results.
What Should Teachers Look For in a Platform?
The term “knowledge graph” should not be the deciding factor when evaluating educational software.
A more useful checklist is:
Question to ask
Why it matters
Can content be associated with specific skills?
Makes assessment more meaningful
Can prerequisite relationships be represented?
Helps provide instructional context
Does the system use evidence over time?
Reduces reliance on isolated answers
Can teachers inspect the evidence?
Supports professional judgment
Can recommendations be explained?
Improves transparency
Can incorrect mappings be corrected?
Protects data quality
Are results actionable?
Turns analytics into useful decisions
Does the system protect learner data?
Essential for responsible use
A platform does not need to advertise a knowledge graph to perform some of these functions.
Conversely, advertising one does not guarantee that its educational model is accurate or useful.
The Most Important Question Is Not “Does It Have a Knowledge Graph?”
The better question is:
Can the platform connect learning activity to meaningful knowledge in a way that improves the next instructional decision?
That shifts attention away from technical labels and toward outcomes.
A genuinely useful system should help answer things like:
What did the learner practice?
What skill did that activity represent?
What evidence has accumulated?
Which related concepts matter?
What remains uncertain?
What should the teacher consider doing next?
If a platform can answer those questions reliably, the underlying architecture becomes much less important to the teacher.
The Future: Connected Learning Instead of Isolated Activities
The broader direction of educational technology is moving toward greater integration between content, learner data, semantic relationships, AI, and adaptive systems.
A mature system does not simply collect data and stop.
It uses new evidence to improve its understanding of what the learner may need next.
Research continues to explore combinations of knowledge graphs, knowledge tracing, graph-based learner modeling, and adaptive recommendation as ways of supporting more personalized educational experiences.
But the technology should remain subordinate to the educational objective.
Better relationships should produce better decisions—not merely more sophisticated dashboards.
Final Takeaway
A knowledge graph in education is best understood as a structured map of relationships among learning concepts, skills, prerequisites, assessment items, resources, and other educational entities.
Its potential value comes from connecting those relationships with learner evidence.
rather than treating every question as an isolated event.
For Gimkit specifically, public documentation confirms a substantial ecosystem around questions, Kits, assignments, practice, Smart Repetition, Classes, and performance reporting. What public documentation does not establish is that Gimkit currently operates a formally documented internal feature called a “Knowledge Graph.”
That distinction is worth preserving because it makes the explanation more trustworthy, not less interesting.
The bigger idea remains powerful: when educational platforms understand the relationships behind content—not just the content itself—they have a stronger foundation for turning learner activity into useful instructional evidence.
And ultimately, that is what makes a connected learning model valuable: not knowing more about the student for its own sake, but using better-structured evidence to help the student learn better.
Professional Recommendations & Expert Reviews
What Is the Gimkit Knowledge Graph? It can be understood as a way of connecting learning concepts, skills, questions, and objectives so they are viewed as related parts of a larger learning structure.
What Is the Gimkit Knowledge Graph? In simple terms, it is a concept for showing how one piece of knowledge can connect to another instead of treating every question as an isolated activity.
What Is the Gimkit Knowledge Graph? The main value of this idea is that it shifts attention from individual answers toward the relationships between the skills and concepts behind those answers.
What Is the Gimkit Knowledge Graph? A useful way to think about it is as a map where different learning concepts act as connected points and the relationships between them show how knowledge fits together.
What Is the Gimkit Knowledge Graph? It can help explain why a student may struggle with an advanced question because the real difficulty may come from an earlier concept that was never fully mastered.
What Is the Gimkit Knowledge Graph? From a teaching perspective, this makes the concept useful for identifying prerequisite skills that should be reviewed before introducing more difficult material.
What Is the Gimkit Knowledge Graph? It can also connect multiple questions to the same underlying skill, making it easier to see that several different activities may be testing related knowledge.
What Is the Gimkit Knowledge Graph? Its strongest educational value comes from showing relationships rather than simply displaying a list of correct and incorrect answers.
What Is the Gimkit Knowledge Graph? It can give teachers a more structured way to think about which concepts students have mastered and which connected concepts may still require practice.
What Is the Gimkit Knowledge Graph? It is particularly interesting from an instructional-design perspective because it encourages teachers to connect objectives, activities, practice, and assessment.
What Is the Gimkit Knowledge Graph? It can help teachers ask whether an activity actually measures the skill it was designed to develop.
What Is the Gimkit Knowledge Graph? It can also help identify whether students need another explanation of the current topic or additional practice with a prerequisite concept.
What Is the Gimkit Knowledge Graph? The concept is therefore more useful as a learning-relationship model than as a simple database of questions.
What Is the Gimkit Knowledge Graph? It can represent a progression in which foundational knowledge supports intermediate skills and those skills eventually support more advanced applications.
What Is the Gimkit Knowledge Graph? This makes it relevant to lesson planning because teachers can organize activities according to the relationships between learning objectives.
What Is the Gimkit Knowledge Graph? It can also support review planning by showing which earlier concepts are connected to a student’s current area of difficulty.
What Is the Gimkit Knowledge Graph? A major advantage of this approach is that it encourages educators to look for patterns instead of reacting to one incorrect answer.
What Is the Gimkit Knowledge Graph? It can make assessment information more meaningful when performance is connected to the particular knowledge or skill being evaluated.
What Is the Gimkit Knowledge Graph? It should not, however, be treated as a complete representation of everything a student knows because learning involves factors that cannot always be reduced to simple relationships.
What Is the Gimkit Knowledge Graph? Teacher observation and student explanations remain important because numerical performance alone cannot always explain why a learner succeeded or struggled.
What Is the Gimkit Knowledge Graph? Its usefulness increases when it is combined with other evidence such as assessments, classroom observations, and student work.
What Is the Gimkit Knowledge Graph? It can therefore be viewed as one layer of educational understanding rather than a replacement for professional teacher judgment.
What Is the Gimkit Knowledge Graph? The concept also fits naturally with personalized learning because different students may need support at different points within the same network of skills.
What Is the Gimkit Knowledge Graph? If one student has mastered a prerequisite while another has not, their next learning activities may reasonably be different.
What Is the Gimkit Knowledge Graph? This makes connected knowledge particularly valuable for identifying targeted intervention instead of giving every student exactly the same additional practice.
What Is the Gimkit Knowledge Graph? It can also help explain why repeated practice is more useful when it reinforces the actual skill or concept that needs improvement.
What Is the Gimkit Knowledge Graph? From a curriculum perspective, the idea encourages teachers to think about how individual lessons contribute to larger learning goals.
What Is the Gimkit Knowledge Graph? From a student perspective, it can represent learning as something that builds progressively rather than as a collection of unrelated quiz results.
What Is the Gimkit Knowledge Graph? The biggest practical benefit is therefore the ability to make relationships between knowledge, skills, questions, and objectives easier to understand.
What Is the Gimkit Knowledge Graph? It can also provide a useful framework for thinking about learning gaps because a missing foundational skill may explain difficulties with several later activities.
What Is the Gimkit Knowledge Graph? This perspective can help teachers avoid assuming that every wrong answer represents a completely separate problem.
What Is the Gimkit Knowledge Graph? Instead, several incorrect answers may point toward one underlying concept that needs attention.
What Is the Gimkit Knowledge Graph? It can therefore support more efficient instructional decisions by helping educators search for the underlying cause of repeated difficulties.
What Is the Gimkit Knowledge Graph? Its broader educational value comes from connecting assessment evidence with the structure of the knowledge students are expected to develop.
What Is the Gimkit Knowledge Graph? It is also useful for understanding why learning objectives should be connected rather than written as completely independent targets.
What Is the Gimkit Knowledge Graph? A strong knowledge structure can help teachers identify what should come first, what depends on previous learning, and what can extend understanding afterward.
What Is the Gimkit Knowledge Graph? As a review concept, it is valuable because it encourages educators to move beyond scores and ask what those scores actually represent.
What Is the Gimkit Knowledge Graph? The concept is best viewed as a connected model of educational knowledge rather than a feature that automatically determines whether a student has learned something.
What Is the Gimkit Knowledge Graph? Its real usefulness depends on how accurately the relationships between concepts and skills are identified and how responsibly the resulting information is interpreted.
What Is the Gimkit Knowledge Graph? Overall, it is best understood as a conceptual map connecting knowledge, skills, questions, prerequisites, and learning objectives so educators can better understand how different parts of learning relate to one another.
Frequently Asked Questions
1. What is a knowledge graph in an educational platform?
An educational knowledge graph is a structured representation of how learning concepts, skills, prerequisites, questions, resources, and other educational entities relate to one another. Instead of treating every question as an isolated item, it provides context around what the question is intended to measure and how that skill connects to other knowledge. This can make assessment data more meaningful and support more targeted learning experiences.
2. Does Gimkit have a publicly confirmed Knowledge Graph?
Gimkit’s public documentation does not currently establish a formally named or documented “Knowledge Graph” as a Gimkit feature. Gimkit does publicly document related capabilities such as Kits, Assignments, reports, student performance data, and Smart Repetition. Those features provide useful learning and assessment data, but they should not automatically be described as evidence that Gimkit operates a formal knowledge-graph system internally.
That distinction matters because a platform can use structured learning data without necessarily implementing a technology that it publicly identifies as a knowledge graph.
3. How could a knowledge graph help understand what a student knows?
It can connect a student’s responses to the concepts and skills represented by those questions. For example, several incorrect answers may all relate to the same underlying skill. Looking at that pattern can provide more useful context than an overall percentage alone.
However, an incorrect response is not proof of a knowledge gap. A reliable learner model should consider multiple interactions, related skills, prerequisites, and evidence over time before making a strong inference.
4. Is a knowledge graph the same as knowledge tracing?
No. They are related but serve different purposes.
A knowledge graph primarily represents relationships between entities such as concepts, skills, questions, and prerequisites. Knowledge tracing focuses on estimating how a learner’s knowledge state changes as new evidence is collected over time.
They can work together:
Technology
Main purpose
Knowledge graph
Maps relationships among learning entities
Knowledge tracing
Models changes in learner knowledge
Assessment system
Collects evidence
Analytics
Interprets performance data
Keeping these roles separate prevents the technology from being overstated.
5. Can a knowledge graph personalize learning?
It can provide an important foundation for personalization, but it does not personalize learning by itself. By connecting skills, prerequisites, assessment items, and learning resources, a knowledge graph can give an adaptive system more context when deciding what content might be appropriate next.
For example, two students may both be working toward the same algebra objective but have different prerequisite strengths. A connected knowledge model can help distinguish those learning paths rather than treating both students as having the same needs.
6. Can knowledge graphs identify a student’s weak areas?
They can help identify patterns that may indicate an area needing attention, but they should not be treated as automatic diagnostic tools.
If a student repeatedly performs poorly on questions mapped to the same skill, that is stronger evidence than one isolated mistake. The system can then examine related prerequisites and previous evidence before suggesting targeted practice.
7. Why are knowledge graphs useful for educational games?
Interactive learning games generate large amounts of question-and-response data. A knowledge graph can provide context for that data by connecting activities to the concepts and skills they represent.
That creates the possibility of moving beyond:
“The student missed this question.”
toward:
“The student may need additional evidence or practice in the skill represented by this question.”
The game supplies the interaction; the knowledge structure can provide additional meaning around that interaction. The educational value ultimately depends on the quality of the content mapping, assessment design, learner model, and teacher interpretation.