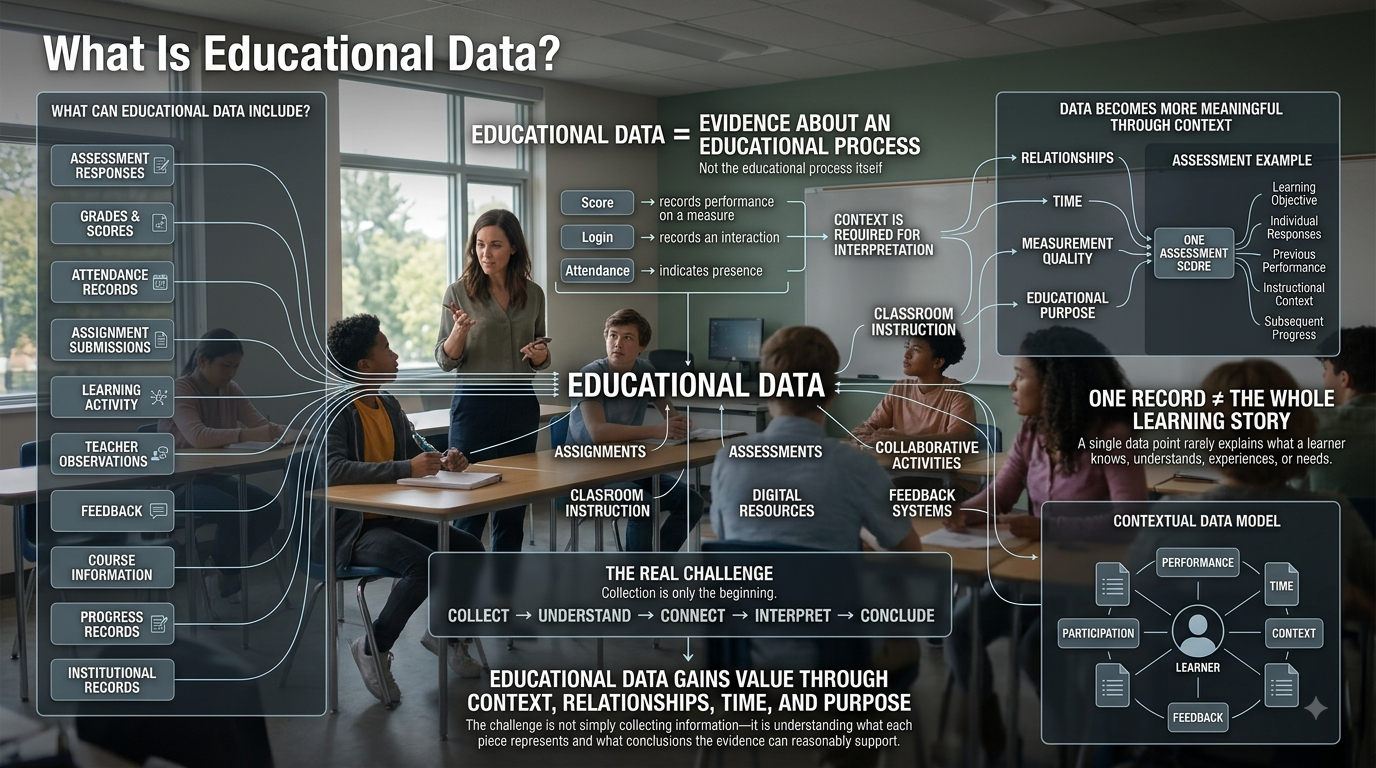
What Is Educational Data? Educational data is the structured and unstructured information generated throughout teaching, learning, assessment, participation, and educational administration. It includes far more than grades or test scores. Attendance records, assessment responses, assignment submissions, learning activity, teacher observations, feedback, course information, progress records, and institutional records can all form part of an educational data environment.
The important distinction is that educational data is evidence about an educational process, not the educational process itself. A score records performance on a particular measure. A login records an interaction with a system. An attendance record indicates presence. None of these, by itself, provides a complete explanation of what a learner knows, understands, experiences, or needs.
Educational data becomes valuable when individual records are given meaning through context, relationships, time, measurement quality, and educational purpose. A single assessment score can describe an outcome, but connecting that score to the learning objective, individual responses, previous performance, instructional context, and subsequent progress can reveal much more about the learning process.
This broader view is essential for understanding modern education because learning environments increasingly generate information across multiple systems. A learner may interact with classroom instruction, assignments, assessments, digital resources, collaborative activities, and feedback systems during the same course. Each produces a different type of evidence. The challenge is not simply collecting all of it. The challenge is determining what each piece of data actually represents, how reliable it is, how different records relate to one another, and what conclusions the evidence can reasonably support.
Looking for comprehensive classroom resources and educational technology insights? Explore GimkitApp for expert guides, teaching strategies, game modes, and the latest updates to enhance student engagement.
What Is Educational Data?
Educational data is information that is generated, collected, recorded, transformed, or interpreted in connection with an educational activity, learner, educator, course, assessment, institution, or learning environment.
It can be generated intentionally, such as when a teacher administers an assessment, or incidentally, such as when a learning platform records that a learner submitted an assignment. It can be numerical, textual, categorical, observational, temporal, or event-based.
Examples include:
A learner’s assessment response.
An assignment submission and revision history.
Attendance for a particular class session.
A rubric-based evaluation.
Teacher feedback on student work.
Course enrollment information.
Progress toward a learning objective.
Participation in a discussion or classroom activity.
Results from a formative assessment.
Records of instructional interventions.
Course completion or progression information.
Institutional enrollment and program records.
The defining characteristic is not the format of the information. It is its relationship to an educational process.
A percentage, timestamp, written comment, observation, or event record can all become educational data when they provide evidence relevant to teaching, learning, assessment, participation, or educational operations.
Educational Data Is Broader Than Grades
Grades are one of the most familiar forms of educational data, but they represent only a small part of the overall information available in an educational environment.
A final grade can indicate an outcome, but it may not reveal:
Which concepts the learner understood.
Which concepts caused difficulty.
Whether mistakes were conceptual or procedural.
How performance changed over time.
How many attempts were required.
What feedback was provided.
Whether the learner improved after additional instruction.
Whether the assessment accurately measured the intended objective.
For example, two learners may both receive 70% on an assessment while reaching that result through very different paths. One may have strong foundational knowledge but struggle with application questions. Another may understand the application questions but make repeated errors on foundational concepts.
The numerical result is identical, but the educational meaning is different.
This is why educational data should be examined as connected evidence rather than isolated numbers.
The Fundamental Relationship Between Data, Information, and Evidence
These concepts are closely related but should not be treated as interchangeable.
Data is the recorded observation or measurement.
Information is data organized or contextualized so that it becomes meaningful.
Evidence is information considered relevant and sufficiently trustworthy for answering a particular question.
For example:
Data: A learner scored 62%.
Information: The learner scored 62% on an assessment covering four learning objectives.
Evidence: Most incorrect responses were concentrated in one objective, and the learner’s performance on that objective has remained weak across several assessments.
The final stage is much more useful for instructional decision-making because the evidence has been connected to a specific educational question.
This does not mean the evidence automatically proves a cause. It means the evidence provides a stronger basis for deciding what should be investigated or addressed next.
The Core Dimensions of Educational Data
Educational data can be understood through several dimensions rather than one universal classification system. The same record may belong to multiple categories depending on the question being asked.
Learner Data
Learner data describes information associated with an individual student’s participation and educational experience.
It may include:
Enrollment and course participation.
Attendance.
Assessment performance.
Assignment activity.
Progress toward objectives.
Submission history.
Feedback.
Academic progression.
Support or intervention records.
Learner data becomes especially valuable when examined longitudinally. A single result provides a snapshot, while a series of results can show change, persistence, improvement, or recurring difficulty.
Assessment Data
Assessment data is generated through activities designed to measure knowledge, skills, understanding, performance, or progress.
It may include:
Total scores.
Individual item responses.
Correct and incorrect answers.
Attempts.
Rubric criteria.
Performance by learning objective.
Formative assessment results.
Summative assessment results.
Feedback associated with responses.
Assessment data can therefore operate at multiple levels. A total score provides a broad outcome, while item-level and objective-level information can provide more specific diagnostic evidence.
Learning Activity Data
Learning activity data records actions associated with learning tasks and educational resources.
Examples include:
Assignment submissions.
Practice attempts.
Lesson completion.
Resource access.
Discussion participation.
Revision activity.
Task completion.
Interaction with digital learning environments.
Activity data can show what happened in a learning environment, but it must not automatically be interpreted as proof of learning.
Opening a resource demonstrates access. It does not demonstrate understanding.
Completing an activity demonstrates completion. It does not necessarily demonstrate mastery.
Attendance and Participation Data
Attendance data records whether a learner was present or recorded as participating during a particular educational event.
Participation data can include classroom contributions, discussion activity, submitted work, or digital interactions.
These measures can provide useful context, but attendance is not the same as engagement, and engagement is not the same as learning.
A learner can be physically present without participating meaningfully. A learner can also learn effectively through activities that generate relatively little observable interaction.
Teacher and Instructional Data
Teachers generate important information that automated systems may not capture adequately.
This can include:
Classroom observations.
Instructional decisions.
Feedback.
Lesson records.
Intervention notes.
Assessment design.
Observed misconceptions.
Instructional adjustments.
Teacher-generated information provides contextual knowledge that numerical systems often lack. At the same time, observations can vary between educators, so consistent definitions and documentation become important when such information is compared or aggregated.
For the latest gaming news, expert reviews, and walkthroughs, readers can also visit IGN, one of the world’s leading gaming websites.
Curriculum and Learning-Objective Data
Curriculum data establishes what learners are expected to know or demonstrate.
It may describe:
Subjects.
Topics.
Standards.
Competencies.
Skills.
Learning objectives.
Course outcomes.
This dimension is critical because a performance measurement has limited meaning without knowing what was being measured.
A score is not simply a number. Its interpretation depends on the objective, task, criteria, assessment conditions, and context surrounding it.
Administrative and Institutional Data
Administrative data describes the operational structure surrounding education.
Examples include:
Enrollment.
Course registration.
Program information.
Class schedules.
Academic records.
Course completion.
Institutional progression.
Resource allocation.
This data may not directly measure learning, but it provides the organizational context necessary to understand educational activity at larger scales.
Where Educational Data Comes From
Educational data can originate from people, assessments, educational systems, institutional processes, and learning activities.
Classroom Activities
Traditional classroom activities remain major sources of educational data.
Teachers generate information through:
Questions and answers.
Classroom discussions.
Written work.
Projects.
Observations.
Formative checks.
Group activities.
Practical demonstrations.
Not all classroom evidence needs to be converted into numerical scores to be useful. A teacher’s structured observation of a recurring misconception may provide important evidence even when no percentage is attached to it.
Assessments
Assessments generate some of the most structured educational datasets.
A single assessment can produce:
Questions presented.
Learner responses.
Correctness.
Scores.
Timing information.
Attempts.
Learning-objective relationships.
Rubric results.
The quality of the resulting data depends partly on the quality of the assessment itself. A technically precise analysis cannot compensate for an assessment that does not adequately measure the intended construct.
Assignments and Coursework
Assignments generate information across the learning process rather than only at a final measurement point.
Relevant records may include:
Submission status.
Submission date.
Revision history.
Rubric results.
Teacher feedback.
Resubmissions.
Completion patterns.
This can help reveal development over time, particularly when the same skill or objective is assessed repeatedly.
Learning Platforms and Digital Systems
Digital educational environments can automatically record events that would otherwise be difficult to capture consistently.
Depending on the system, records may include:
Logins.
Resource access.
Activity completion.
Assessment attempts.
Assignment submissions.
Course progress.
Interaction events.
Automation improves the ability to collect information at scale, but it does not automatically improve interpretation.
A system can record an event with extreme precision while still providing only limited evidence about what the event means.
Student Information Systems
Student information systems commonly contain administrative and academic records associated with learners and courses.
These systems can provide context such as:
Enrollment status.
Course registration.
Program affiliation.
Academic progression.
Class assignment.
Institutional records.
Such information becomes particularly important when educational data from different systems needs to be connected.
Teacher Observations and Human Records
Human-generated records remain important because many educational phenomena are difficult to capture through automated events.
A teacher may observe that a learner:
Uses an incorrect reasoning strategy.
Understands an idea verbally but struggles with written expression.
Requires a different explanation.
Has corrected a recurring misconception.
Demonstrates understanding in a collaborative setting.
These observations can complement quantitative data rather than compete with it.
How Educational Data Is Classified
There is no single classification system that captures every educational dataset. Classification depends on the purpose of the analysis.
The same assessment result could simultaneously be classified as learner data, assessment data, quantitative data, structured data, primary data, and longitudinal data.
Understanding these overlapping perspectives prevents artificial divisions between categories.
Structured, Semi-Structured, and Unstructured Data
Structured Data
Structured data follows predefined fields and formats.
Examples include:
Field
Example
Learner identifier
Student record ID
Course
Biology 101
Assessment
Unit Assessment
Score
82%
Date
Assessment date
Objective
Cell structure
Structured data is relatively easy to sort, aggregate, compare, and analyze, provided that the underlying definitions are consistent.
Semi-Structured Data
Semi-structured data contains organizational information but does not necessarily follow a rigid table.
Examples include:
Event records.
Metadata.
Tagged submissions.
System logs.
Learning activity records.
These datasets often require additional processing before they can be compared consistently.
Unstructured Data
Unstructured educational data includes information without a fixed tabular structure.
Examples include:
Essays.
Teacher comments.
Student reflections.
Audio recordings.
Video recordings.
Open-ended responses.
Unstructured data can contain rich contextual information, but extracting consistent measurements from it is more difficult.
Quantitative and Qualitative Educational Data
Quantitative Data
Quantitative data expresses observations numerically.
Examples include:
Scores.
Counts.
Percentages.
Completion rates.
Attendance totals.
Response times.
Number of attempts.
Quantitative data is useful for comparison and measurement, but numerical precision does not guarantee conceptual validity.
A system can measure the number of clicks with perfect accuracy while still failing to measure engagement accurately.
Qualitative Data
Qualitative data describes experiences, explanations, observations, or characteristics that may not naturally reduce to a single number.
Examples include:
Teacher comments.
Learner reflections.
Open-ended responses.
Classroom observations.
Interview responses.
Qualitative information can explain patterns that quantitative data identifies but cannot fully explain.
The strongest educational analysis often uses both.
Primary, Derived, and Interpreted Data
Primary Data
Primary data is collected directly from the original educational activity.
Examples include:
A student’s original assessment response.
A teacher’s direct observation.
An assignment submission.
An attendance record.
Derived Data
Derived data is calculated or transformed from existing records.
Examples include:
Average score.
Completion percentage.
Growth rate.
Attendance rate.
Performance trend.
Derived measurements can be useful, but their meaning depends on the quality and definitions of the underlying data.
An average can hide important differences between learners. A completion rate can look strong while masking whether the completed work actually demonstrated understanding.
Interpreted Data
Interpretation occurs when data is examined in context to answer an educational question.
For example:
Raw observation: Performance decreased from one assessment to the next.
Interpretation: The decline may be associated with increased task difficulty, a change in content, reduced preparation, or another contextual factor.
The important point is that interpretation should remain proportional to the evidence. Data can support an investigation without proving a specific explanation.
Cross-Sectional and Longitudinal Educational Data
Cross-Sectional Data
Cross-sectional data describes a particular point or period.
It can help answer questions such as:
How did this class perform on this assessment?
Which objectives were strongest during this unit?
How did two groups compare during the same period?
Its strength is comparison at a defined moment.
Its limitation is that it provides limited information about change over time.
Longitudinal Data
Longitudinal data follows observations across multiple points in time.
It can reveal:
Improvement.
Decline.
Recurring difficulties.
Progress toward objectives.
Changes following an intervention.
Long-term participation patterns.
Longitudinal analysis is particularly valuable because educational outcomes are dynamic. However, changes over time still require contextual interpretation. A trend can identify that something changed without automatically explaining why.
Formative and Summative Educational Data
Formative Data
Formative data is used during learning to guide instruction and provide feedback while there is still an opportunity to adjust the learning process.
Examples include:
Quick checks for understanding.
Practice results.
Draft feedback.
In-class questions.
Diagnostic activities.
Its main value is responsiveness.
Summative Data
Summative data is generally used to evaluate learning after a defined period, unit, course, or assessment cycle.
Examples include:
Final assessments.
End-of-unit examinations.
Final project evaluations.
Course-level outcomes.
Formative and summative data serve different purposes, but they can be connected. A summative result can become part of longitudinal evidence used to understand later learning.
Learning data is narrower and focuses primarily on the learning process, learner activity, progress, and outcomes.
This distinction matters because educational environments generate information that does not directly measure learning but still affects how learning is organized and understood.
A course schedule is educational data, but it is not itself evidence of learning.
A learner’s assessment response is both educational data and learning-related data.
Keeping these concepts distinct prevents an administrative record from being mistaken for a learning measurement.
From Raw Data to Educational Insight
The real value of educational data emerges when raw observations are connected to a meaningful question.
Consider a learner who receives 58% on an assessment.
The score alone provides limited information.
Add the assessment objectives, and we know what was measured.
Add item-level responses, and we can identify where errors occurred.
Add previous assessments, and we can determine whether the result represents improvement or decline.
Add teacher observations, and we gain contextual information about possible misconceptions.
Add a follow-up assessment, and we can evaluate whether subsequent instruction changed performance.
The individual records have become more valuable because their relationships provide a richer picture than any single measurement.
The Educational Data Lifecycle
Educational data should be understood as moving through a lifecycle rather than remaining a static collection of records.
Create → Collect → Validate → Store → Organize → Integrate → Analyze → Interpret → Act → Evaluate
Data Creation
An educational event produces the original observation.
This may be a learner response, teacher observation, assignment submission, assessment result, attendance event, or administrative record.
The quality of later analysis is partly determined at this stage because a measurement designed for one purpose cannot automatically answer a different question.
Data Collection
The observation enters an educational system or record.
Collection may be:
Manual.
Automated.
Synchronized between systems.
Imported.
Generated through assessment tools.
The collection method influences completeness, consistency, and timing.
Data Validation
Validation checks whether the collected records are usable.
Important checks include:
Missing values.
Duplicate records.
Invalid values.
Incorrect identifiers.
Inconsistent dates.
Conflicting categories.
Unexpected changes in data volume.
Validation should occur before analysis because a sophisticated analytical method cannot repair fundamentally incorrect records.
Data Storage
Educational information is stored in databases, learning platforms, institutional systems, files, or other controlled environments.
Storage is not merely a technical question. Access controls, protection, retention, and appropriate handling are part of responsible educational data management.
Data Organization
Records must be organized around meaningful entities and relationships.
A score becomes more interpretable when connected to:
Learner → Course → Assessment → Learning Objective → Date → Response → Result
Without reliable relationships between records, combining datasets can create misleading conclusions.
Data Integration
Integration connects information from different systems.
For example:
Student information system + learning platform + assessment system + teacher records
The difficult part is not simply transferring records between systems. The systems must also agree about what their fields represent.
A field called “completion” can have different meanings in different platforms. A learner identifier may also be represented differently across systems.
Integration therefore requires semantic consistency as well as technical connectivity.
Data Analysis
Analysis identifies patterns, differences, relationships, distributions, or changes.
The method should match the educational question.
A simple comparison may be sufficient for one question, while a large longitudinal dataset may require more advanced analytical methods.
More complex analysis is not automatically more useful.
Data Interpretation
Interpretation connects analytical findings to educational meaning.
This is where professional judgment becomes essential.
A low score does not automatically identify the reason for the low score.
A high number of platform interactions does not automatically demonstrate engagement.
A relationship between two variables does not automatically establish causation.
Decision and Action
Evidence can inform educational decisions such as:
Reteaching a concept.
Providing additional practice.
Revising an assessment.
Adjusting instructional pacing.
Offering targeted support.
Reviewing a course design.
The purpose of analysis is not simply to produce another report. It is to support better-informed action.
Evaluation
After action is taken, new evidence can show whether the response produced the intended result.
This creates a continuous cycle:
Evidence → Decision → Intervention → New Evidence → Evaluation
That feedback loop is one of the most important characteristics of a mature educational data environment.
The Learning Data Ecosystem
A learning data ecosystem is the connected environment of people, activities, technologies, records, processes, and decisions through which learning-related data is generated and used.
Each component captures a different part of the educational process.
A learning platform may record activity.
An assessment system may record performance.
A teacher may record observations.
An institutional system may provide enrollment context.
When these sources are interpreted together, they can provide a more complete picture than any individual system can provide alone.
However, integration does not mean that every source should automatically be combined or treated as equally meaningful.
The central question remains:
What does this source actually tell us, and what can it not tell us?
Why Educational Context Changes the Meaning of Data
The same measurement can mean different things under different circumstances.
A 70% score could represent:
Improvement from a previous 50%.
Decline from a previous 90%.
Strong performance on a difficult assessment.
Weak performance on a relatively easy assessment.
Likewise, a late assignment could result from:
Poor time management.
A technical problem.
A changed deadline.
An unusual personal circumstance.
A misunderstanding of the submission requirement.
The timestamp alone cannot distinguish these explanations.
Context therefore acts as an interpretive layer between measurement and conclusion.
Before drawing a conclusion, ask:
What exactly was measured?
Why was it measured?
How was it collected?
When was it collected?
What population does it represent?
What conditions existed at the time?
What does the measurement exclude?
Is it comparable with the other records?
Are alternative explanations possible?
These questions help prevent simple measurements from becoming overly confident conclusions.
Educational Data Quality, Analysis, Governance, and Responsible Use
Educational Data Quality
The usefulness of educational data depends heavily on its quality. A dataset can be large, technically sophisticated, and visually impressive while still producing unreliable conclusions if the underlying records are incomplete, inconsistent, poorly defined, or inappropriate for the question being investigated.
Educational data quality should therefore be considered throughout the entire lifecycle rather than checked only immediately before analysis.
Accuracy
Accuracy asks whether a recorded value correctly represents the underlying event or attribute.
If an assessment score is recorded incorrectly, the resulting analysis may be wrong even if every later calculation is mathematically perfect.
Accuracy problems can arise from:
Manual entry errors.
Incorrect learner associations.
Faulty imports.
Incorrect assessment scoring.
Duplicate records.
System configuration problems.
Completeness
Completeness concerns whether important information is missing.
Missing data is not always random. For example, learners who stop participating may generate fewer digital records, meaning the absence of activity can itself affect the dataset.
A dataset with many records can therefore still provide an incomplete picture if important groups, periods, or variables are systematically missing.
Consistency
Consistency means that the same concept is represented in compatible ways.
If one system defines “completed” as opening an activity while another defines it as submitting the activity, combining those fields without examining their definitions can create misleading results.
Timeliness
Timeliness concerns whether information is available and current enough for its intended purpose.
A report used for immediate instructional decisions requires different timing characteristics from a historical institutional analysis.
Old information is not automatically useless, but its age must be considered when interpreting what it represents.
Validity
Validity asks whether the measurement actually represents the concept it is being used to measure.
This is one of the most important distinctions in educational data.
A platform may accurately count:
Number of logins = 12
But that does not establish:
Level of learning = high
The system may have measured login activity accurately while the interpretation is invalid.
Relevance
Relevant data directly contributes to answering the educational question.
If the question is about mastery of a particular learning objective, collecting hundreds of unrelated interaction events may add volume without adding useful evidence.
The strongest datasets are not necessarily the largest. They are the datasets containing information that is appropriate to the decision being made.
Measurement Quality and What Educational Data Can Actually Tell Us
Every educational measurement has a scope.
A measurement should therefore be interpreted according to what it was designed to capture.
Activity Is Not Automatically Learning
Digital activity can provide useful evidence about participation and interaction, but activity alone does not establish understanding.
A learner may repeatedly access a resource because they are struggling with it. Another learner may access it once because they already understand the concept.
The same activity pattern can therefore have different educational meanings.
Performance Is Not the Same as Understanding
Assessment performance provides evidence about performance under particular conditions.
It can be extremely useful, but a single score does not necessarily represent the full depth of a learner’s understanding.
Assessment design, question quality, context, prior knowledge, and testing conditions all influence what the result means.
Attendance Is Not Automatically Engagement
Being present provides evidence of attendance.
It does not necessarily establish attention, participation, understanding, or motivation.
Likewise, low observable participation does not automatically mean that meaningful learning is absent.
Engagement Is Not a Single Universal Metric
Engagement can involve behavioral, cognitive, emotional, and social dimensions.
A single count such as:
logins + clicks + time online
cannot automatically represent the entire construct of engagement.
This is why educational measurement requires clear definitions before metrics are interpreted.
Reliability, Validity, and Educational Measurement
Reliability and validity answer different questions.
Reliability concerns the consistency or stability of a measurement.
Validity concerns whether the measurement supports the intended interpretation.
A measurement can be highly consistent while measuring the wrong thing.
For example, a system could consistently count every learner’s clicks with perfect technical reliability. That does not make click count a valid measure of conceptual understanding.
Strong educational measurement therefore requires both dependable measurement processes and appropriate interpretation.
Data Definitions and Semantic Consistency
One of the most overlooked parts of educational data management is defining what individual fields actually mean.
Terms such as:
Active learner.
Completed activity.
Engaged learner.
Successful attempt.
Mastery.
Participation.
At-risk learner.
Course completion.
can have different meanings across institutions and systems.
A dataset becomes difficult to interpret when the same word represents different rules.
For example, if one platform considers an activity complete after it is opened while another requires submission, the word completion cannot safely be treated as equivalent across both systems.
A strong educational data environment therefore needs a shared semantic layer:
Term → Definition → Measurement Rule → Data Source → Context → Limitations
This makes the data understandable not only to the system that generated it but also to the people who later analyze and interpret it.
Metadata in Educational Data
Metadata is information that describes other data.
It can explain:
Where a record came from.
When it was created.
What a field means.
Which system generated it.
What unit is being used.
Which version of an assessment was applied.
How a value was calculated.
What population is represented.
Metadata becomes increasingly important as datasets grow and multiple systems are connected.
Without metadata, a number can survive long after its original context has been forgotten.
A field containing 82 is not meaningful until we know whether 82 represents a percentage, score, count, percentile, or another measurement.
Data Lineage
Data lineage describes the path information follows from its original source through transformation, storage, integration, analysis, and reporting.
A simplified lineage may look like:
Assessment Response → Scoring System → Student Record → Aggregated Dataset → Analysis → Dashboard
Knowing this path makes it easier to answer important questions:
Where did this value originate?
Which transformation produced it?
Was it changed during integration?
Which dataset supplied the dashboard?
Which calculation produced the reported percentage?
Data lineage is particularly important when an unexpected result appears because analysts can trace the value backward instead of investigating blindly.
This prevents a common problem: searching through large datasets simply because they are available and then treating whatever patterns appear as inherently meaningful.
Descriptive Analysis
Descriptive analysis summarizes what has already happened.
Examples include:
Average scores.
Median scores.
Completion rates.
Attendance rates.
Distribution of responses.
Frequency of errors.
Performance by objective.
Descriptive analysis is often the first step because it establishes the basic shape of the data before more complex interpretations are attempted.
Diagnostic Analysis
Diagnostic analysis investigates patterns to understand where a problem or difference may be occurring.
For example:
A class performs poorly overall.
Further analysis shows that:
Most objectives were successful.
One objective produced unusually high error rates.
The errors were concentrated in a particular question type.
This narrows the instructional question.
However, diagnostic analysis should distinguish between identifying where a pattern occurs and proving why it occurred.
Predictive Analysis
Predictive analysis uses historical or current information to estimate possible future outcomes.
Educational applications may include estimating:
Possible course completion.
Future performance.
Likelihood of needing additional support.
Potential progression outcomes.
Predictions are estimates rather than certainties.
A prediction should therefore be treated as a signal for investigation and support, not as an unquestionable statement about a learner’s future.
Prescriptive and Decision-Oriented Analysis
Prescriptive approaches attempt to identify actions that may be appropriate based on available evidence.
For example, a system may identify that a group is struggling with a particular objective and suggest additional practice or instructional review.
However, the final educational decision should consider context that automated analysis may not capture.
A recommendation can inform professional judgment without replacing it.
Correlation Does Not Establish Causation
One of the most important principles in educational data analysis is the distinction between association and causation.
Suppose learners who complete more practice activities also achieve higher assessment scores.
This establishes an observed relationship.
It does not automatically prove that the additional practice caused the higher scores.
Other factors may contribute:
Prior knowledge.
Motivation.
Access to support.
Available study time.
Instructional differences.
Learner characteristics.
Assessment familiarity.
Responsible analysis therefore uses language proportional to the evidence.
Instead of:
Practice activity caused higher achievement.
A more defensible interpretation might be:
Higher practice activity was associated with higher assessment performance in the observed dataset.
That distinction protects educational decision-making from false certainty.
Bias in Educational Data
Educational data can contain bias because data reflects the methods, populations, measurements, and systems through which it was created.
Bias can enter through:
Unequal participation.
Missing records.
Assessment design.
Sampling decisions.
Historical policies.
Measurement choices.
Platform access differences.
Human judgment.
Inconsistent data collection.
A dataset can therefore appear objective because it contains numbers while still reflecting limitations in how those numbers were produced.
A responsible analysis asks:
Who is represented? Who may be missing? What was measured? What was not measured? Under what conditions was it collected?
Missing Data
Missing data should not automatically be treated as meaningless absence.
A missing value can result from:
A technical failure.
A learner not participating.
A field not being required.
A system not collecting the information.
A change in policy.
A transfer between systems.
The reason for missingness matters.
For example, if learners who disengage from a course are also less likely to generate activity records, simply removing those missing records may make the remaining dataset appear healthier than the actual population.
Missingness is therefore both a data-quality issue and a potential analytical signal.
Outliers and Anomalies
An outlier is an observation that differs substantially from the broader pattern.
Examples include:
An unusually high assessment score.
An extremely low completion time.
An unexpected number of attempts.
An unusual participation pattern.
An outlier should not automatically be deleted.
It may represent:
A genuine exceptional result.
A data-entry error.
A technical issue.
A legitimate unusual case.
A change in measurement conditions.
The correct approach is investigation rather than automatic removal.
Data Governance
Educational data governance defines how data should be managed, protected, interpreted, accessed, maintained, and used.
A mature governance framework establishes:
Who is responsible for the data.
What the data is intended to accomplish.
Who may access it.
How access is controlled.
How definitions are maintained.
How errors are corrected.
How long information is retained.
How changes are documented.
How data quality is monitored.
How responsible use is enforced.
Governance is therefore not simply an IT function.
It connects policy + people + processes + technology + accountability.
Educational Data Privacy
Educational data can contain information associated with identifiable learners and therefore requires careful handling.
Responsible privacy practices generally include:
Collecting only information that has a legitimate purpose.
Limiting access according to role and need.
Protecting stored and transmitted information.
Avoiding unnecessary exposure of identifiable records.
Establishing appropriate retention practices.
Documenting how information is used.
Providing appropriate transparency about data practices.
Privacy should be considered at the beginning of a data project rather than added after the system has already been designed.
Data Minimization
Data minimization means avoiding unnecessary collection and retention of information.
The principle is straightforward:
Collect what is necessary for the legitimate purpose, not everything that can technically be collected.
Large datasets can create additional:
Privacy exposure.
Storage requirements.
Governance complexity.
Security risks.
Interpretation problems.
A smaller, clearly defined dataset can sometimes provide stronger educational evidence than a much larger but poorly understood collection of records.
Access Control and Role-Based Use
Not every person in an educational organization needs access to every dataset.
Access should correspond to legitimate responsibilities.
For example:
A teacher may need information required to support students in a class.
An administrator may need aggregated program-level information.
A data analyst may require controlled access to specific datasets.
Technical staff may need system-level access without requiring unrestricted educational interpretation rights.
Role-based access reduces unnecessary exposure while supporting legitimate educational work.
Data Retention
Educational data should not automatically be retained forever simply because storage is inexpensive.
Retention decisions should consider:
Purpose.
Educational value.
Operational requirements.
Legal and policy requirements.
Privacy implications.
Security risks.
Whether the information is still necessary.
When the original purpose no longer exists, continued retention should have a clear justification.
Responsible Use of Educational Data
Responsible educational data use means recognizing that data represents real learners, teachers, classrooms, and educational experiences.
Educational data should support learners rather than reduce them to numerical labels.
A prediction that identifies a learner as potentially needing support should create an opportunity for investigation and assistance, not become an irreversible judgment about that learner.
Educational Data and AI
Artificial intelligence can process educational data at scales that would be difficult to manage manually.
Potential applications include:
Identifying patterns.
Summarizing large datasets.
Classifying responses.
Detecting recurring misconceptions.
Supporting personalized practice.
Generating analytical summaries.
Identifying unusual patterns.
Supporting predictive models.
However, AI does not remove the fundamental requirements of educational data quality.
Poorly defined data + advanced AI = sophisticated analysis of a weak foundation.
AI systems can also reproduce limitations present in historical datasets.
Therefore, AI-supported educational analysis should still require:
Clear definitions.
Quality controls.
Appropriate validation.
Human oversight.
Transparency about limitations.
Responsible handling of sensitive information.
Predictive Models and Learner Risk
Predictive systems can estimate which learners may require additional support based on patterns in historical or current data.
Such models should be treated carefully because prediction can influence how educators perceive and respond to learners.
A predicted risk is not an identity.
It does not mean:
“This learner will fail.”
It means:
“Based on the available evidence and model assumptions, this learner’s observed pattern resembles patterns associated with a particular outcome.”
That distinction is essential.
Predictions should therefore be used to trigger appropriate investigation, additional support, or closer observation rather than to replace educational judgment.
Educational Dashboards and Data Visualization
Dashboards transform datasets into visual representations that help users monitor patterns.
Useful educational dashboards may display:
Performance trends.
Progress toward objectives.
Attendance.
Completion.
Assessment results.
Participation patterns.
Group-level outcomes.
A dashboard is valuable when it makes an important pattern easier to understand and act upon.
It becomes less useful when it simply displays large numbers of metrics without explaining:
What each metric means.
Who is included.
What period is represented.
How the metric was calculated.
What the metric cannot establish.
Good visualization reduces cognitive effort without reducing the accuracy of interpretation.
Educational Data at Different Levels
Educational data can support decisions at multiple levels.
Learner Level
At the learner level, data can support:
Feedback.
Progress monitoring.
Identification of learning gaps.
Additional practice.
Reflection.
Goal setting.
The objective should be support and improvement rather than unnecessary labeling.
Classroom Level
At the classroom level, educators can identify:
Common misconceptions.
Difficult objectives.
Assessment patterns.
Participation differences.
Instructional areas requiring adjustment.
Classroom-level analysis can help move from individual observations to broader instructional decisions.
Program Level
Program-level analysis can reveal patterns across multiple courses or cohorts.
It can support questions about:
Course progression.
Completion.
Curriculum alignment.
Assessment consistency.
Resource needs.
Institutional Level
At the institutional level, educational data can inform:
Enrollment planning.
Program evaluation.
Resource allocation.
Academic progression.
Institutional performance monitoring.
As the scale increases, aggregation, governance, definitions, privacy, and comparability become increasingly important.
Educational Data for Continuous Improvement
The strongest educational data practices are iterative.
A teacher identifies weak performance in a learning objective.
Assessment data confirms the pattern.
Item-level analysis identifies the specific misconception.
Instruction is adjusted.
A follow-up activity produces new evidence.
The teacher evaluates whether performance improved.
The process then informs the next instructional decision.
This is more valuable than treating data analysis as a one-time reporting exercise.
Common Educational Data Mistakes
Collecting Data Without a Question
A large dataset is not automatically useful.
The educational question should come first.
Treating Every Metric as Learning
Clicks, logins, time online, and completion events can be useful indicators, but they should not automatically be interpreted as direct measurements of learning.
Ignoring Definitions
A metric without a clear definition cannot be interpreted reliably.
Combining Incompatible Data
Two fields that appear similar may represent different concepts.
Ignoring Missing Data
Missing records can distort conclusions and may themselves contain information about participation or system behavior.
Treating Correlation as Causation
A relationship between variables does not automatically prove that one caused the other.
Overusing Aggregates
Averages and percentages can hide important variation.
Trusting Dashboards Without Examining the Underlying Data
A polished visualization can still be based on incomplete, inconsistent, or poorly defined information.
Using Historical Data Without Context
Changes in curriculum, assessment design, policies, populations, technology, or collection methods can make historical comparisons misleading.
Keeping Data Without a Continuing Purpose
Long-term retention creates additional governance and privacy responsibilities.
Best Practices for Building a Strong Educational Data Environment
A mature educational data environment should follow a connected set of principles.
Begin With the Educational Question
Determine what decision needs to be supported before deciding what information to collect.
Define Every Important Measurement
Document what terms such as completion, engagement, mastery, participation, and progress actually mean.
Preserve Context
Maintain the information needed to understand when, where, why, and under what conditions a measurement was produced.
Track Data Lineage
Know where important values originated and what transformations occurred before they reached a report or dashboard.
Monitor Quality Continuously
Check accuracy, completeness, consistency, validity, timeliness, and relevance throughout the lifecycle.
Connect Systems Carefully
Integrate data only when learner identities, time periods, definitions, and relationships are sufficiently aligned.
Separate Measurement From Interpretation
A system records an observation; educators and analysts determine what that observation can reasonably mean.
Use the Appropriate Level of Granularity
Preserve detailed records when diagnostic analysis requires them, while using aggregation when broader decisions call for it.
Protect Sensitive Information
Use appropriate access controls, security measures, retention practices, and privacy protections.
Make Uncertainty Visible
Where the evidence is incomplete or multiple explanations are possible, the analysis should communicate that uncertainty rather than hiding it.
Evaluate the Effect of Decisions
Data should continue through the cycle after an intervention so educators can determine whether the action produced the intended outcome.
A Practical Educational Data Framework
A strong educational data workflow can be organized into these connected stages:
The strength of the analysis comes from connecting multiple forms of evidence while avoiding claims that exceed what the evidence can establish.
Educational Data Maturity
Educational organizations can differ significantly in how they manage data.
A basic environment may primarily collect records for administrative reporting.
A more developed environment may standardize definitions, monitor quality, integrate systems, and provide meaningful analytics.
A mature environment goes further by connecting:
Data quality + shared definitions + interoperability + governance + analytics + professional interpretation + continuous improvement
The goal of maturity is not maximum technological complexity.
The goal is an environment in which educational data is:
understandable, trustworthy, appropriately connected, responsibly managed, and useful for real decisions.
The Relationship Between Educational Data and Learning Analytics
Educational data is the broader information environment.
Learning analytics is a specialized practice that uses data to understand and support learning and educational processes.
The relationship can be represented as:
Educational Data → Learning-Related Data → Analysis → Learning Analytics → Educational Decision
Not every educational data activity is learning analytics.
Recording enrollment information, for example, is educational data management. Analyzing learner progression across courses to understand patterns of continuation can become part of learning analytics.
The distinction matters because data collection and analytical interpretation are different activities.
Educational Data and Educational Data Mining
Educational data mining focuses on computational techniques for discovering patterns and relationships within educational datasets.
Methods can include:
Classification.
Clustering.
Pattern discovery.
Prediction.
Sequence analysis.
Anomaly detection.
These methods can reveal patterns that are difficult to identify manually, especially in large datasets.
However, computational discovery does not automatically establish educational meaning.
A statistically detectable pattern still needs to be interpreted within the context of the educational question, measurement design, and data limitations.
Educational Data and Institutional Decision-Making
At the institutional level, data can support decisions about:
Course demand.
Enrollment patterns.
Student progression.
Program performance.
Resource allocation.
Assessment outcomes.
Support services.
Institutional data becomes particularly powerful when decision-makers can distinguish between descriptive information and evidence strong enough to justify a particular action.
A trend can identify where attention may be needed without automatically identifying the correct intervention.
What High-Quality Educational Data Looks Like
High-quality educational data is not simply data with many records.
It is data where:
The purpose is clear.
Definitions are documented.
Measurements are appropriate.
Important records are sufficiently complete.
Values are reasonably accurate.
Different systems use compatible meanings.
Time and context are preserved.
Data lineage can be understood.
Access is appropriately controlled.
Limitations are known.
Interpretation remains proportional to evidence.
Results can support a legitimate educational decision.
This is the difference between data volume and data value.
Educational Data: The Complete Mental Model
The most useful way to understand educational data is as a connected system rather than a collection of isolated records.
Educational activity creates observations.
Data systems capture those observations.
Data quality processes determine whether the records can be trusted.
Definitions and metadata explain what the records mean.
Integration connects related information.
Analysis identifies patterns.
Context and professional judgment give those patterns educational meaning.
Governance and privacy determine how the information can responsibly be used.
Decisions and interventions turn evidence into action.
Evaluation produces new evidence and begins the cycle again.
The complete model is:
Activity → Data → Quality → Context → Integration → Analysis → Interpretation → Decision → Action → Evaluation → New Data
This model captures the central principle of educational data: the value is not in the record alone, but in the trustworthy relationship between the record, the question, the context, and the decision it supports.
Final Takeaway
Educational data is the broader information foundation underlying modern teaching, learning, assessment, participation, and educational operations. It includes numerical results, written observations, activity records, assessment responses, attendance, assignments, curriculum information, institutional records, and many other forms of evidence.
Its value depends on disciplined interpretation.
A score should be understood according to what the assessment measured. A platform interaction should be understood as an interaction unless additional evidence supports a stronger interpretation. A prediction should remain a prediction rather than becoming a fixed judgment. A correlation should remain an observed relationship unless stronger evidence supports a causal conclusion.
The strongest educational data practices therefore connect several principles:
Educational data is most powerful when it moves beyond collection and reporting into a disciplined evidence cycle:
Ask the right question → collect the right evidence → verify its quality → understand its context → analyze it appropriately → interpret its limits → make an informed decision → evaluate the result.
That is what turns educational data from a collection of records into a meaningful foundation for understanding and improving educational processes.
Frequently Asked Questions
What is educational data?
Educational data is information generated, collected, or recorded through learning, teaching, assessment, participation, and educational administration. It can include assessment responses, grades, attendance, assignment activity, feedback, course progress, classroom observations, enrollment records, and information produced by digital learning systems.
Is educational data the same as student data?
Not exactly. Student data is a major part of educational data, but educational data is broader. It can also include information about courses, assessments, teaching activities, classroom performance, institutional operations, curriculum, and educational resources.
What are the main types of educational data?
Common types include learner data, assessment data, attendance and participation data, assignment and coursework data, feedback data, behavioral and interaction data, teacher-generated data, curriculum and learning-objective data, administrative data, and institutional data. These categories can overlap because the same record may serve several purposes.
What is the difference between educational data and learning data?
Learning data focuses specifically on information related to learning activities, learner progress, performance, and outcomes. Educational data is the broader concept and can include learning data as well as teaching, assessment, administrative, institutional, and operational information.
Where does educational data come from?
It can come from assessments, assignments, classroom activities, teacher observations, attendance systems, learning management systems, student information systems, digital learning platforms, surveys, feedback tools, course records, and institutional systems. The source determines what kind of evidence the data can provide.
Why is educational data important?
Educational data helps educators and institutions replace assumptions with evidence. It can reveal patterns in performance, identify areas where learners need additional support, monitor progress, evaluate instructional approaches, and inform decisions about courses, programs, and educational resources.
Can educational data measure learning directly?
Not always. Some educational data provides direct evidence of performance on a particular task, while other data only provides indirect signals. For example, completing a digital activity demonstrates participation, but it does not automatically prove that the learner understood the material.
What is the educational data lifecycle?
The educational data lifecycle describes how information moves from creation to use. A typical lifecycle includes creation, collection, validation, storage, organization, integration, analysis, interpretation, decision-making, action, and evaluation. The process is continuous because actions taken from one dataset can generate new information.
What is data quality in education?
Data quality describes whether information is suitable and reliable for its intended purpose. Important dimensions include accuracy, completeness, consistency, timeliness, relevance, and validity. High-quality analysis cannot compensate for data that was incorrectly collected, poorly defined, or interpreted beyond what it represents.
Why does context matter when interpreting educational data?
The same result can have different meanings in different situations. A lower score could indicate a learning difficulty, a particularly difficult assessment, unfamiliar content, unclear instructions, or other circumstances. Context helps distinguish what the data actually demonstrates from what someone might merely assume it demonstrates.
What is a learning data ecosystem?
A learning data ecosystem is the connected environment of learners, educators, institutions, educational technologies, activities, records, and processes through which learning-related information is generated and used. It emphasizes relationships between different sources rather than treating every dataset as an isolated record.
What is the difference between quantitative and qualitative educational data?
Quantitative data represents information numerically, such as scores, counts, percentages, completion rates, or time measurements. Qualitative data provides descriptive information, such as teacher observations, written feedback, reflections, or open-ended responses. Using both can provide a more complete understanding than relying on either form alone.
What is structured educational data?
Structured educational data is organized according to predefined fields or formats. Examples include learner identifiers, course codes, assessment scores, dates, attendance records, and completion statuses. Its consistent structure makes it easier to store, compare, filter, and analyze.
What is unstructured educational data?
Unstructured educational data does not follow a rigid predefined table structure. Examples include essays, written feedback, open-ended responses, audio recordings, classroom notes, and other free-form content. It can contain valuable context but generally requires additional methods to organize and interpret consistently.
What is educational data governance?
Educational data governance is the framework of policies, responsibilities, standards, and controls used to manage educational information appropriately. It addresses questions such as who can access data, how information is defined, how it is protected, how long it is retained, how errors are corrected, and how data may be used.
Does more educational data always lead to better decisions?
No. More data can introduce duplication, irrelevant information, inconsistent definitions, additional privacy risks, and unnecessary complexity. The most useful dataset is usually the one that contains relevant, reliable, well-defined evidence connected to a specific educational question.
How can educational data support teachers?
Teachers can use educational data to identify misconceptions, monitor progress, compare performance across learning objectives, recognize patterns in participation, evaluate instructional approaches, and determine where additional practice or explanation may be useful. The data should support professional judgment rather than replace it.
How can educational data support students?
When used appropriately, educational data can help learners understand their progress, identify areas that need improvement, monitor completion, recognize patterns in their performance, and receive more targeted support. Its purpose should be to improve learning opportunities rather than reduce a learner to a collection of metrics.
What is the relationship between educational data and learning analytics?
Learning analytics is a field concerned with collecting, analyzing, interpreting, and using data about learners and learning. Educational data is the broader body of information from which many analytics activities draw. Learning analytics therefore represents one important way of working with educational data rather than being a complete synonym for it.
What is educational data mining?
Educational data mining applies computational and statistical techniques to educational datasets to discover patterns, relationships, or useful predictions. It can be used to investigate learner behavior, performance, assessment patterns, or other educational phenomena, but not every educational data activity requires data mining.
Can artificial intelligence improve the use of educational data?
AI can help process large datasets, identify patterns, summarize information, classify records, generate insights, and support certain predictive tasks. However, AI does not automatically make educational data reliable. Poor definitions, incomplete records, biased datasets, or inappropriate measurements can still produce misleading results regardless of the technology used.
What is predictive analytics in education?
Predictive analytics uses existing data to estimate the likelihood of future outcomes, such as continued participation, course completion, or potential performance. These predictions represent probabilities rather than certainties. They should therefore support investigation and appropriate intervention rather than determine a learner’s future without human judgment.
How can educational data be used responsibly?
Responsible use begins with a clear educational purpose. Data collection should be relevant and proportionate, access should be appropriately controlled, sensitive information should be protected, definitions should be documented, limitations should be understood, and conclusions should not exceed what the evidence supports.
What is the biggest mistake when using educational data?
One of the biggest mistakes is treating a recorded measurement as if it represents more than it actually does. A login is not automatically engagement, engagement is not automatically learning, a score is not a complete description of ability, and correlation is not proof of causation.
Professional Recommendations & Expert Reveiws
What Is Educational Data refers to information collected or generated through teaching, learning, assessment, and educational activities.
What Is Educational Data includes information that helps educators understand how students participate, progress, perform, and learn.
What Is Educational Data can come from classrooms, schools, learning platforms, assessments, surveys, and other educational systems.
What Is Educational Data is broader than test scores because learning produces many different types of information.
What Is Educational Data can include student performance, attendance, participation, assignments, feedback, and learning activity.
What Is Educational Data can help teachers understand what students know and where additional support may be needed.
What Is Educational Data can provide evidence for making instructional decisions instead of relying entirely on assumptions.
What Is Educational Data becomes more useful when it is connected to a specific educational question or goal.
What Is Educational Data can be collected before, during, and after learning activities.
What Is Educational Data may include information generated automatically by digital learning tools.
What Is Educational Data can also come from observations and records created directly by teachers.
What Is Educational Data includes assessment results that show how learners perform against particular objectives.
What Is Educational Data can include formative assessment information gathered during instruction.
What Is Educational Data can include summative assessment results collected at the end of a learning period.
What Is Educational Data may include quiz results that help identify specific areas of understanding.
What Is Educational Data can include assignment submissions that provide evidence of student knowledge and skills.
What Is Educational Data can include attendance information that helps schools understand participation patterns.
What Is Educational Data may include classroom participation records when teachers track engagement in activities.
What Is Educational Data can include student responses to surveys about their learning experiences.
What Is Educational Data may include feedback that students provide about lessons, resources, and instructional approaches.
What Is Educational Data can include information about course completion and progression.
What Is Educational Data can help identify patterns across individual learners, classes, courses, or larger groups.
What Is Educational Data can be quantitative, meaning it is represented through numbers or measurable values.
What Is Educational Data can also be qualitative, including observations, comments, reflections, and open-ended responses.
What Is Educational Data becomes stronger when quantitative and qualitative evidence are considered together.
What Is Educational Data should not be interpreted as a complete representation of a learner’s abilities based on one measurement.
What Is Educational Data requires context because the same result can have different explanations.
What Is Educational Data can reveal that a student is struggling, but it may not explain the underlying reason by itself.
What Is Educational Data therefore works best when teachers combine evidence with professional knowledge and direct interaction with learners.
What Is Educational Data can help identify learning gaps between intended objectives and demonstrated performance.
What Is Educational Data can help teachers decide which concepts require additional explanation or practice.
What Is Educational Data can support differentiated instruction when evidence shows that learners have different needs.
What Is Educational Data can help teachers adjust lesson pacing when students need more or less time with a concept.
What Is Educational Data can support more targeted feedback by showing specific areas where improvement is needed.
What Is Educational Data can help students understand their own progress when information is presented clearly.
What Is Educational Data can encourage students to reflect on strengths, weaknesses, and learning strategies.
What Is Educational Data can support personalized learning when information is used carefully and appropriately.
What Is Educational Data can help identify successful learning patterns that educators may want to reinforce.
What Is Educational Data can show whether particular learning resources are being used effectively.
What Is Educational Data can help teachers evaluate whether classroom activities are supporting intended learning objectives.
What Is Educational Data can support curriculum evaluation by showing how students respond to different content and instructional approaches.
What Is Educational Data can help schools examine broader patterns in achievement and participation.
What Is Educational Data can support educational planning by providing evidence about learner needs and institutional performance.
What Is Educational Data can help administrators identify areas where additional resources or support may be required.
What Is Educational Data can include information about courses, programs, teaching practices, and learning environments.
What Is Educational Data can be used to evaluate whether educational initiatives are producing the intended results.
What Is Educational Data can help researchers investigate how different learning conditions affect educational outcomes.
What Is Educational Data can support studies of student behavior, achievement, engagement, and progression.
What Is Educational Data can be generated through digital platforms when learners interact with online lessons and activities.
What Is Educational Data may include information about resource access, activity completion, responses, and other digital interactions.
What Is Educational Data should not be confused with learning itself because recorded activity only provides evidence about parts of the learning process.
What Is Educational Data can show that a student completed an activity without proving that the student fully understood it.
What Is Educational Data therefore needs careful interpretation before conclusions are made.
What Is Educational Data can become misleading when incomplete information is treated as a complete picture.
What Is Educational Data requires attention to accuracy because errors in collection can affect later decisions.
What Is Educational Data should be collected for clear and meaningful purposes rather than simply because information is available.
What Is Educational Data raises important questions about privacy because educational records can contain sensitive information.
What Is Educational Data should be handled according to appropriate privacy, security, and institutional requirements.
What Is Educational Data requires responsible access controls so that information is available only to appropriate people.
What Is Educational Data should be communicated carefully because labels or scores can influence how learners are perceived.
What Is Educational Data can create problems when a single metric is used to make overly broad judgments about a student.
What Is Educational Data should therefore be considered alongside multiple forms of evidence whenever important decisions are being made.
What Is Educational Data can become more valuable when different sources provide complementary information.
What Is Educational Data can connect assessment evidence with classroom observations, student feedback, and learning activity.
What Is Educational Data can help educators move from simply recording results toward understanding learning patterns.
What Is Educational Data can support data-informed teaching when teachers use evidence to adjust instruction thoughtfully.
What Is Educational Data should not replace teacher judgment because educational decisions often require information that cannot be captured numerically.
What Is Educational Data works best when teachers remain actively involved in interpreting what the information means.
What Is Educational Data can support early identification of learners who may benefit from additional academic attention.
What Is Educational Data can help educators monitor whether interventions are producing meaningful improvements.
What Is Educational Data can also help determine when an intervention is not working and needs to be changed.
What Is Educational Data can support continuous improvement by allowing educators to compare evidence over time.
What Is Educational Data can help schools recognize trends rather than focusing only on isolated results.
What Is Educational Data becomes particularly useful when the information leads to a clear action or improvement.
What Is Educational Data is most valuable when collection, interpretation, and decision-making are connected to genuine educational needs.
What Is Educational Data continues to expand as schools use more digital platforms, assessment systems, learning technologies, and analytical tools.
What Is Educational Data therefore requires educators and institutions to understand both its potential benefits and its limitations.
What Is Educational Data is not simply a collection of numbers, records, or reports; it is evidence that can help explain important aspects of educational experiences.
What Is Educational Data can help teachers compare student performance across different assignments without relying on a single assessment.
What Is Educational Data can highlight recurring misconceptions that may require a different explanation or additional practice.
What Is Educational Data can help identify which learning objectives have been mastered and which still need reinforcement.
What Is Educational Data can support lesson reflection by showing whether students responded as expected to a particular teaching activity.
What Is Educational Data can help educators recognize changes in engagement before those changes become larger learning problems.
What Is Educational Data can provide useful evidence when teachers review the effectiveness of different classroom strategies.
What Is Educational Data can support comparisons between planned learning outcomes and the skills students actually demonstrate.
What Is Educational Data can help schools identify achievement patterns across subjects, grade levels, or learning groups.
What Is Educational Data can reveal differences in participation that may encourage educators to examine classroom accessibility and inclusion.
What Is Educational Data can support more efficient use of teaching time by identifying areas where students need the greatest attention.
What Is Educational Data can help educators distinguish between widespread difficulties and problems affecting only a small number of learners.
What Is Educational Data can be especially useful when collected consistently because repeated measurements make changes easier to recognize.
What Is Educational Data can help establish a clearer picture of progress when results are reviewed across an extended period.
What Is Educational Data should be presented in ways that teachers and students can understand without requiring advanced analytical skills.
What Is Educational Data becomes less useful when complicated reports hide the practical information educators actually need.
What Is Educational Data can support stronger educational decisions when the information is accurate, relevant, timely, and interpreted within context.
What Is Educational Data ultimately has the greatest value when it helps educators understand what learners need and turn that understanding into practical improvements.
What Is Educational Data can help teachers identify which instructional activities produce stronger understanding and which may need adjustment.
What Is Educational Data can reveal patterns in student responses that point toward common areas of confusion.
What Is Educational Data can help educators plan targeted revision instead of repeating entire lessons unnecessarily.
What Is Educational Data can support more focused classroom discussions by showing which concepts deserve deeper attention.
What Is Educational Data can help teachers recognize when students are progressing at different rates within the same learning environment.
What Is Educational Data can provide evidence for adjusting assignments when the level of difficulty does not match student readiness.
What Is Educational Data can help educators evaluate whether additional learning resources are actually being used and understood.
What Is Educational Data can support better communication between teachers, students, and educational teams when findings are explained clearly.
What Is Educational Data can help students set realistic learning goals when progress information is accurate and understandable.
What Is Educational Data can provide useful evidence during parent-teacher discussions about academic progress and areas requiring support.
What Is Educational Data can help schools evaluate whether support programs are reaching the learners they were designed to assist.
What Is Educational Data can contribute to evidence-based curriculum planning by showing patterns across multiple groups and learning periods.
What Is Educational Data can help identify strengths as well as weaknesses, allowing educators to build on successful learning behaviors.
What Is Educational Data can become more powerful when it is reviewed regularly rather than collected and forgotten.
What Is Educational Data ultimately works best when it remains connected to meaningful educational questions, responsible interpretation, and practical action.
Conclusion
Educational data is not simply a collection of grades, attendance records, or digital activity logs. It is a broad evidence environment created through the interaction of learners, teachers, assessments, learning activities, educational technologies, classrooms, courses, and institutions.
Its real value comes from understanding how those pieces connect.
A score can show an outcome. An assessment response can reveal where difficulty occurred. Assignment activity can show participation. Teacher observations can provide context. Learning objectives can explain what was being measured. Historical records can show change over time. When these sources are connected carefully, educational data becomes far more useful than any isolated number.
At the same time, educational data has clear limits. A system can record an event precisely without proving what that event means. A learner can open a resource without understanding it. A high participation count does not necessarily demonstrate deep engagement. A correlation between two variables does not establish that one caused the other. A prediction describes a possibility, not a guaranteed future.
That is why context, data quality, clear definitions, and professional interpretation are central to responsible educational data use.
A strong educational data practice follows a simple principle:
Ask the right question → identify the right evidence → verify its quality → connect it with context → interpret it carefully → make an informed decision → evaluate the result.
This approach also explains why educational data should be viewed as an ecosystem rather than a collection of disconnected records. Different systems capture different parts of the educational experience, and their usefulness increases when those parts can be connected without losing their original meaning.
The strongest educational data environments therefore do not focus on collecting the maximum possible amount of information. They focus on collecting appropriate evidence for meaningful educational questions, maintaining its quality, protecting it responsibly, and using it to improve decisions.
Ultimately, educational data should serve education rather than become the objective itself. Data provides evidence; educators provide interpretation; learners remain the people those decisions are meant to support.